Ecommerce Profit Margins: Benchmarks & Tracking
Revenue looks good until you subtract every cost that actually matters. Most Shopify and WooCommerce merchants overestimate their margins by 50-70% because they're not counting every line item, according to Shopiator, drawn from their work with 500+ ecommerce brands. A store doing $50,000 a month in revenue with a 10% net margin takes home less than a store doing $20,000 at 30%. This guide shows you what to count, what healthy margins actually look like by category, and how to connect margin data to pricing decisions with tools like Zorin that protect your bottom line instead of quietly eroding it.
Why Most Merchants Get Their Margins Wrong
The standard ecommerce P&L looks simple: revenue minus cost of goods sold minus ad spend equals profit. The problem is that formula misses 25-65% of your actual costs.
Here is what typically happens. A merchant opens Shopify, sees $50,000 in monthly sales, subtracts $20,000 in product cost and $5,000 in ads, and concludes they made $25,000. That looks like a 50% margin. But once you add payment processing fees, Shopify's subscription and transaction fees, app subscriptions, packaging, return shipping, refunds, currency conversion, and the merchant's own time, that $25,000 can shrink to $5,000 or less. Sometimes it goes negative.
The gap between gross margin and net margin is where most ecommerce businesses lose track of their profitability. According to Finaloop's ecommerce profit benchmarks, which cover hundreds of seven- and eight-figure DTC brands with $3.16 billion in combined sales, the median net profit margin in 2024 was about 3%, even though gross margins at these brands commonly look healthy.
The full cost stack: from COGS to what's left
Your true cost of goods sold is more than what you paid your supplier. It includes the product itself, inbound shipping from the supplier to your warehouse, packaging materials, customs duties if you import, and any manufacturing or assembly labor. That gets you to gross margin.
Between gross margin and net margin sits everything else: outbound shipping to customers, payment processing (2.9% + $0.30 per transaction on Shopify Payments, higher on third-party gateways), platform subscription fees, app subscriptions (the average Shopify store runs 6-8 paid apps), ad spend across Meta and Google (often 15-30% of revenue), return processing (ecommerce returns average 20-30%, each costing $10-20 in reverse logistics), refunds and chargebacks, currency conversion fees for international sales, and the merchant's own time.
Most of these costs don't appear in Shopify's native reporting. That's not a bug in Shopify. It's just not what Shopify's dashboard was built to show. Revenue and gross margin are visible. Everything between gross and net is scattered across your ad platforms, your 3PL invoices, your app billing emails, and your bank statements.
If you are pricing your products based on gross margin alone, you are pricing blind. You need the full picture before any pricing decision makes sense, whether that decision comes from gut feel or from a per-SKU elasticity model that calculates exactly how much room you have to move.
Margin vs Markup: The Confusion That Costs You Money
Margin and markup describe the same profit from two different directions. Getting them mixed up is one of the fastest ways to underprice your products by accident.
Markup starts from cost. If a product costs you $30 and you sell it for $60, your markup is 100%. You doubled the cost.
Margin starts from revenue. That same $30 cost on a $60 sale gives you a 50% margin. Half the selling price is profit.
Here's where the confusion gets expensive. A merchant who targets a "50% markup" on a $30 product sets the price at $45. They think they are keeping half. But the actual margin on that sale is only 33%. That is a 17-point gap between what they believe they are earning and what they actually are.
The formula for each:
- Margin = (Selling Price - Cost) / Selling Price x 100
- Markup = (Selling Price - Cost) / Cost x 100
For pricing decisions, margin is the more useful metric because it tells you what percentage of every dollar that comes in is actually profit. Markup is useful when setting initial prices from a cost base, but always convert back to margin before evaluating whether a price is sustainable. The full conversion formulas and a margin-to-markup chart are in our margin vs markup guide. If you are using Zorin's profit-lift estimates to decide whether to raise or hold on a product, the estimate means more when you know your real margin going in, not just your markup.
What Healthy Margins Actually Look Like by Category
There is no single "good" ecommerce profit margin. Beauty brands and electronics stores operate in completely different margin environments. Your target depends on your vertical, your business model, and your channel mix.
Here are rough 2026 ranges by category, drawing on TrueProfit's benchmarks across 5,000+ stores and public company filings. Treat them as directional starting points rather than precise targets:
| Category | Gross Margin Range | Net Margin Range | Primary Margin Driver |
|---|---|---|---|
| Beauty & Skincare | 65-85% | 15-25% | Low COGS, high perceived value |
| Supplements & Health | 65-78% | 10-20% | Recurring purchases, subscription potential |
| Fashion & Apparel | 50-65% | 8-15% | High return rates (20-30%) compress net |
| Home & Garden | 45-60% | 10-18% | Shipping costs on bulky items |
| Food & Beverage | 40-55% | 5-12% | Perishability, cold chain logistics |
| Electronics | 15-30% | 2-8% | Price transparency, razor-thin commodity margins |
| Digital Products | 85-95% | 60-80% | Near-zero COGS after creation |
| Handmade & Artisan | 40-60% | 15-25% | Labor-intensive, but premium pricing accepted |
A few things stand out. First, the gap between gross and net is enormous in every category. A beauty brand at 70% gross and 10% net is spending 60 cents of every revenue dollar on operations, marketing, and fulfillment. Second, the top quartile in every category earns 2-3x the median net margin. The difference is not the product. It is operational discipline and pricing accuracy. For the fully sourced version of these figures, with citations back to the original SEC filings and investor disclosures behind each number, see our gross margin reference by category.
If your margins fall below the low end of your category range, there is either a cost problem or a pricing problem to find. If your margins seem above the high end, verify your accounting is capturing all cost layers. Inflated margins usually mean missing costs, not superior performance. Marketing spend is usually the single largest swing factor behind that gap, our sourced breakdown of ad spend as a percentage of revenue by category shows just how much that ranges by vertical.
DTC vs marketplace: how channel mix shifts the numbers
Where you sell changes your margin math significantly. Amazon charges referral fees of 9-15% by category on top of FBA fulfillment fees, which compresses net margins 5-8 percentage points compared to selling DTC through Shopify. A brand doing 70% DTC and 30% Amazon will show a very different P&L than the same brand at 30% DTC and 70% Amazon, even with identical products.
If you sell on multiple channels, track margins per channel, not just blended across the whole store. A blended number can hide the fact that one channel is profitable and another is losing money on every order. For a deeper look at this, our guide on pricing differently across platforms covers when and why the same product might need different prices on different channels.
See what Zorin's elasticity model says about your own catalog.
Start free trialWhen Rising Costs Force the Pricing Question
Supplier prices go up. Shipping rates climb. Platform fees increase. Every cost increase lands on one of two places: the customer's receipt or your margin. There is no third option.
When a cost rises and your price stays the same, you just volunteered to absorb it. Do that across enough line items and you quietly turn a profitable year into a merely busy one.
The math merchants underestimate: if your store runs a 25% gross margin and you absorb a 10% cost increase without adjusting price, that margin drops to roughly 17.5%. That is not a rounding error. It is a 30% cut in profitability from a single supplier increase you chose not to pass on. According to Small Business Majority, about 76% of businesses pass at least some cost increases to customers, while 60% also absorb a portion.
The real question is not "should I raise prices." It is "which products can handle a raise without losing volume, and which can't."
That is an elasticity question, not a margin question alone. A product with inelastic demand (elasticity between 0 and -1) can absorb a 5-8% price increase with minimal volume loss. A product with elastic demand (elasticity below -1.5 or -2) will see a proportionally larger sales drop. Without knowing which category each SKU falls into, the decision to raise or hold is a guess.
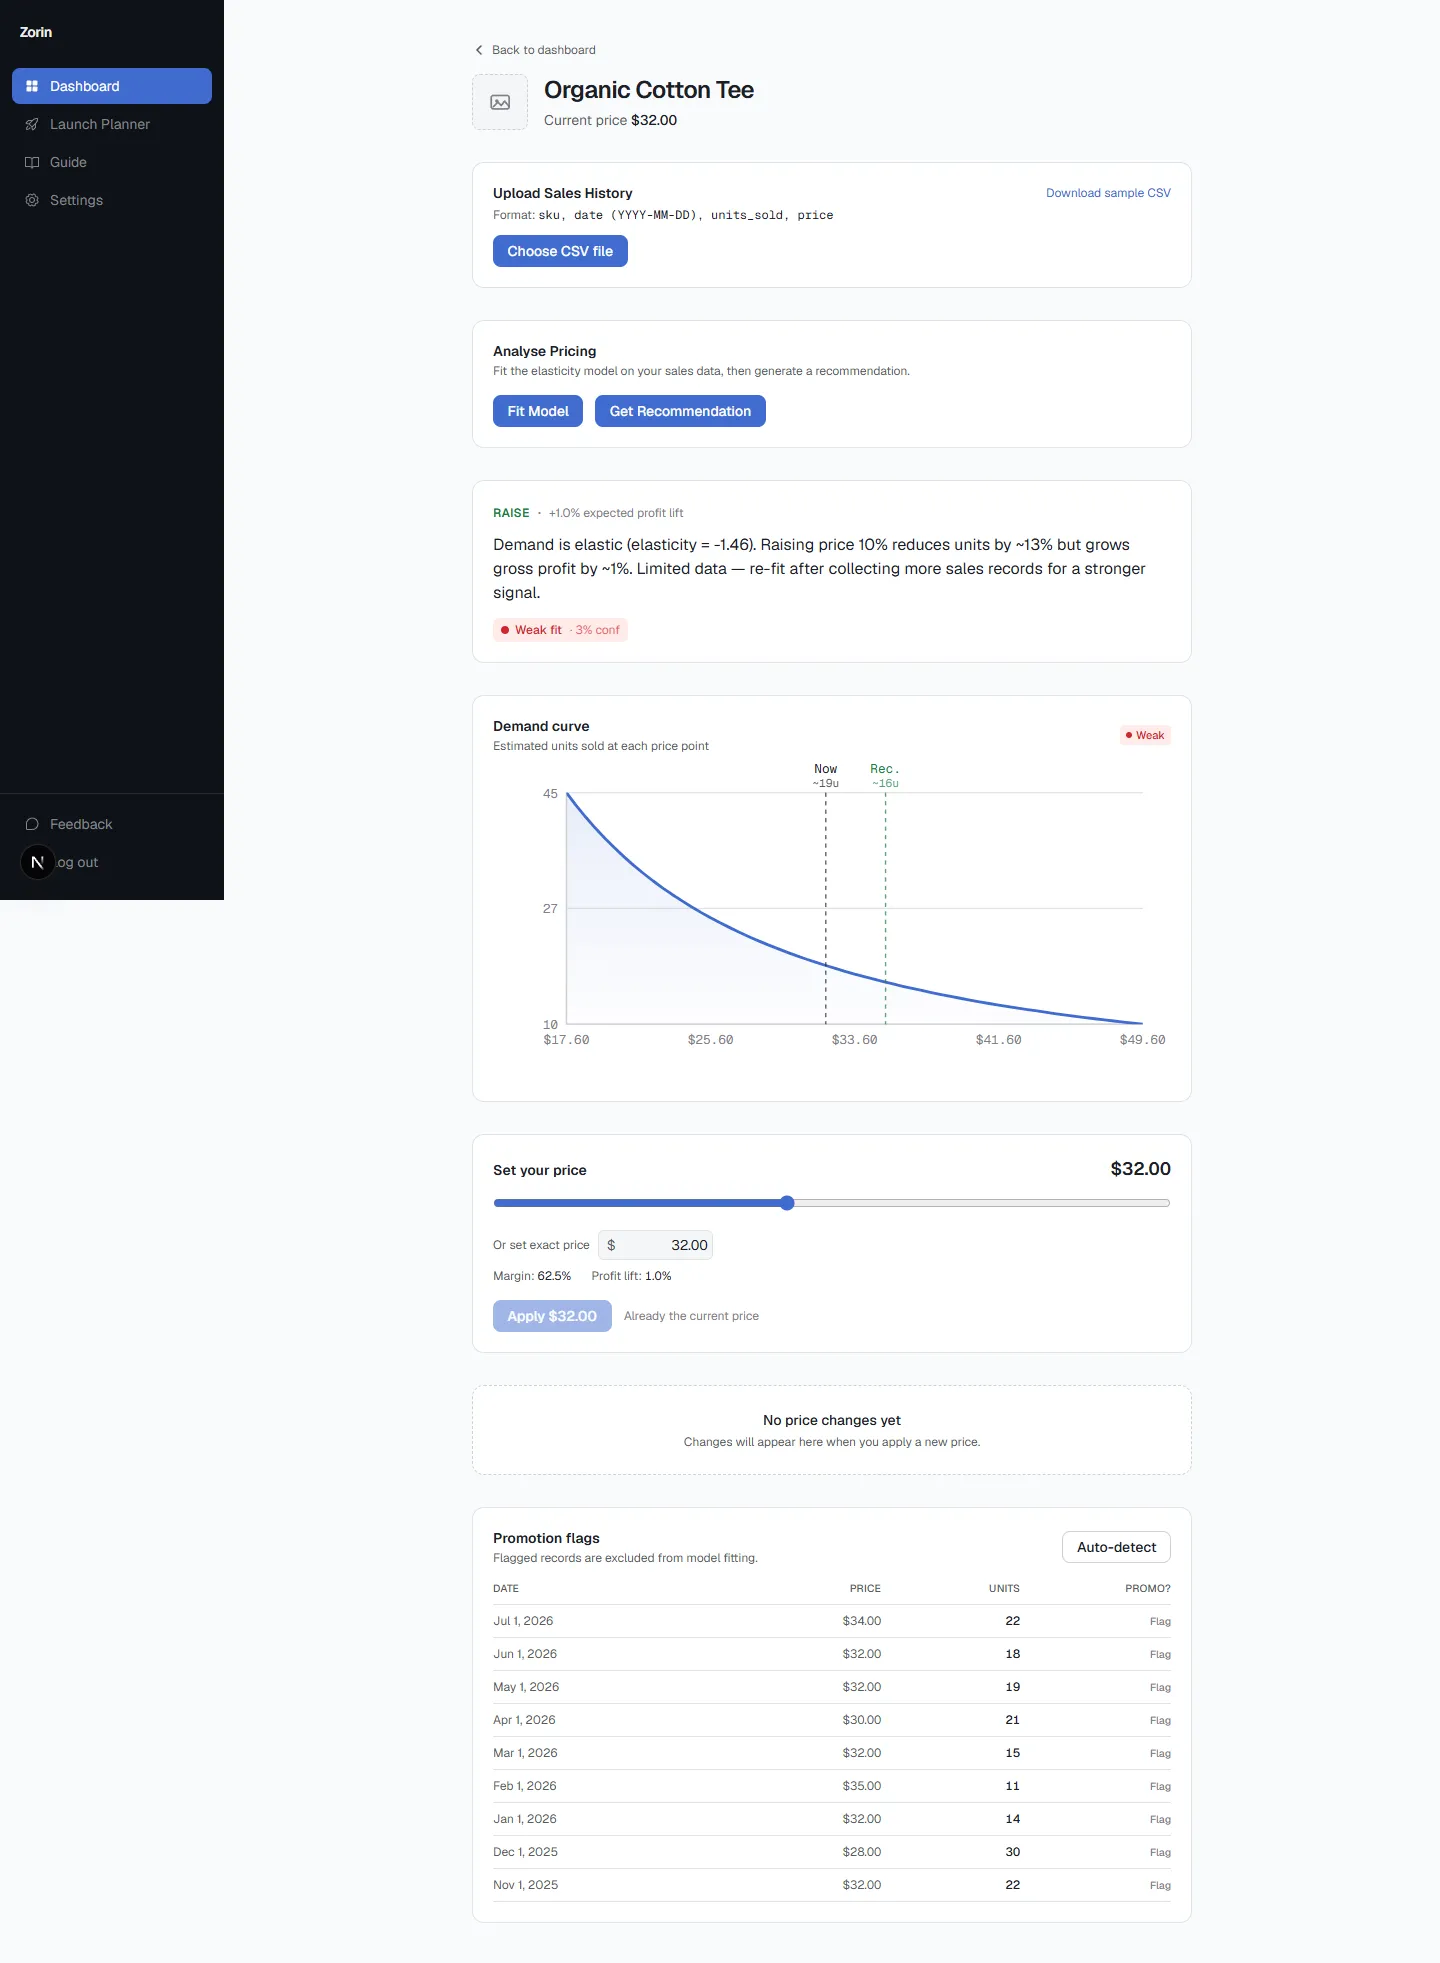
This is where per-SKU elasticity data turns a gut call into a calculated one. A merchant running Zorin can see which products tolerate a raise and which don't before committing to anything. When the tool shows you an elasticity of -0.8 with a Strong confidence label and says "raise to $42, estimated profit lift 11%," that recommendation only makes sense if you know your true margin at the current price. Margin is the context. Elasticity is the action.
McKinsey's "The Power of Pricing" analysis found that for the average S&P 1500 company, a 1% price increase with volume held constant translates to roughly an 8% increase in operating profit. The catch is the "if volume stays constant" part. Elasticity data is how you test that assumption before you bet your revenue on it.
How to Actually Track Your Margins on Shopify
Shopify does have native profit reporting. It tracks gross margin if you fill in the "cost per item" field on each product. Go to any product in your admin, scroll to Pricing, and enter your cost. Shopify will automatically calculate profit and margin on that product.
The limitation is that this only captures gross margin based on a single cost figure. It does not account for shipping, ad spend, returns, app fees, payment processing, or any of the other costs that sit between gross and net. Shopify's native finance reports show net sales, cost of goods sold, gross profit, and gross margin. That is it.
There is also a COGS tracking gap: Shopify stores only one cost per SKU at a time. If your supplier raises prices from $30 to $35 and you update the product, all historical reporting now uses $35 as the cost, even for orders that were fulfilled at $30. This distorts historical margin accuracy.
For a quick estimate of where you stand right now, you can use the Shopify profit margin calculator on our site. It walks you through the cost lines most merchants forget.
If you want per-order or per-product net margin tracking, you will need either a dedicated profitability app (TrueProfit, BeProfit, and Lifetimely are popular options), a well-maintained spreadsheet that pulls from multiple sources, or an accounting integration that consolidates Shopify payouts with your actual expense data. The important thing is to pick one approach and actually use it. A margin number you check monthly is infinitely more useful than a perfect system you never build.
Key Takeaways
- A "good" net margin for most Shopify/WooCommerce stores is 10-20%. Top performers hit 20%+, but the median DTC brand runs closer to 3%.
- Gross margin and net margin are not the same thing. The gap between them, often 35-40 percentage points, is where most profit leaks hide.
- Margin and markup are not interchangeable. A 50% markup is only a 33% margin. Always price in margin terms.
- Track COGS properly. Include inbound shipping, packaging, duties, and processing fees, not just the supplier invoice.
- Use elasticity data before raising prices. Knowing your margin tells you where you stand. Knowing your elasticity tells you which prices you can actually move without killing sales.
Frequently Asked Questions
What's a good profit margin for an online store on Shopify or WooCommerce?
A healthy net profit margin for most Shopify and WooCommerce stores falls between 10-20%. Early-stage stores often run 2-5% while scaling. Gross margins typically sit between 50-70% depending on category. Beauty and supplements run highest; electronics run lowest.
How do I calculate my true cost of goods sold when Shopify doesn't track all my costs?
Start with your supplier cost per unit, then add inbound shipping, packaging, customs duties, and any assembly labor. That is your true COGS. For everything between gross and net, track payment fees, shipping, returns, ad spend, and app costs separately. Shopify's native reporting only covers gross margin based on a single cost-per-item field.
What's the difference between margin and markup?
Margin is profit as a percentage of the selling price. Markup is profit as a percentage of the cost. On a $60 product that costs $30, the margin is 50% and the markup is 100%. The same dollar profit, described from two different starting points. Use margin when evaluating profitability; use markup when setting initial prices from a cost base.
Should I raise prices to cover rising supplier and shipping costs?
It depends on your products' price elasticity. Products with inelastic demand can absorb a price increase with minimal sales drop. Products with elastic demand will lose volume faster than the price increase adds revenue. Check your per-SKU elasticity before deciding. Most businesses (76%, per Small Business Majority) pass at least part of cost increases to customers.
What are the average profit margins by ecommerce category in 2026?
Ranges vary widely. Beauty runs 65-85% gross / 15-25% net. Fashion runs 50-65% gross / 8-15% net. Electronics runs 15-30% gross / 2-8% net. Digital products run 85-95% gross / 60-80% net. These are benchmarks from aggregated industry data, not targets. Compare against your specific category.
How often should I recalculate my margins?
Monthly at minimum. Costs shift: supplier prices change, ad CPMs fluctuate seasonally, shipping carrier rates adjust. A margin that was healthy in January may not be by June. Set a monthly review cadence and flag any product whose net margin has dropped more than 5 points since the last check. For how often those margin findings should translate into actual price changes, see the pricing review cadence guide.
Is a 50% gross margin good for a Shopify store?
It depends on the category. For fashion, 50% gross is solid. For beauty, it is below average. For electronics, it would be exceptional. Gross margin alone also does not tell you whether the business is profitable. A store at 50% gross can still lose money if operating costs, ad spend, and returns eat the rest.
Can I track product-level profit in Shopify without an app?
Shopify's native admin shows gross margin per product if you enter cost per item. For net margin per product, you will need either a profitability app like TrueProfit or BeProfit, a custom spreadsheet pulling data from multiple sources, or an accounting integration. Native Shopify reporting stops at gross margin.
How does selling on Amazon affect my margins compared to Shopify DTC?
Amazon charges referral fees of 9-15% plus FBA fulfillment fees, which compress net margins 5-8 percentage points versus DTC on Shopify. The same product at the same price will net you less on Amazon. Track margins per channel to avoid hiding losses on one platform behind profits on another.
What's the fastest way to improve margins without increasing prices?
Reducing your cost per order is the quickest lever. A $1 reduction per order across 1,000 monthly orders saves $12,000 a year, roughly equivalent to a 1-2% net margin improvement. Focus on renegotiating shipping rates, consolidating app subscriptions, reducing return rates with better product descriptions and sizing guides, and automating manual workflows.
Knowing your real margin is step one. Knowing which prices to move, and by how much, is step two. Zorin connects both by reading your sales history per SKU, calculating the elasticity, and showing you the estimated profit lift before you commit to a change. No guessing, no copying a competitor's number, just your own data telling you where the margin opportunity actually is. If you're on WooCommerce specifically, here's how its fee structure actually compares before you assume a no-platform-fee setup means better margin by default. Start a free trial to see what your own catalog's numbers say.
Written by Dexter
Dexter is part of the team at Zorin, building tools that help ecommerce merchants price with data instead of guesswork.
More in Margin & Profit Fundamentals
View all →Margin vs Markup: Formulas, Chart & Examples
Markup is profit over cost; margin is profit over price. Formulas, a margin to markup chart, Costco and e.l.f. examples, and the mistake that costs you.
WooCommerce vs Shopify Fees: Real Margin Compared
No platform fee doesn't mean better margin. WooCommerce vs Shopify transaction, hosting and plugin costs compared, and how to find your real net profit.
How to Know If Your Prices Are Too High or Too Low
Declining sales and high close rates are lagging signals. Price elasticity tells you before you change anything, not after the damage is done.