Pricing Simulation Tools: Test a Price First
A pricing simulation tool lets you test a price change before you make it: you enter a new price and it estimates what happens to units sold, revenue and profit. The estimate is only as good as the demand model behind it, so the useful tools build that model from your own sales history and show a range of outcomes, not a single confident number. When the range points both ways, the right answer is often to hold and gather more data rather than move.
What Is a Pricing Simulation Tool?
A pricing simulator, sometimes called a price simulation tool or pricing scenario tool, answers "what if?" questions. What if this product cost $33 instead of $30? What if we cut the whole category 10% for a month? What if costs rise and we pass half of it on? Instead of changing a live price and waiting to see, the simulator predicts the outcome from a model of how customers respond to price.
Every simulator has the same three parts: a baseline (current price, cost and sales), a demand model (how sales change when price changes) and an objective (usually profit, sometimes revenue or units). The demand model is the part that separates a useful tool from a spreadsheet that just multiplies numbers.
Types of Pricing Simulation Tools
| Type | Where the demand model comes from | Best for | Main weakness |
|---|---|---|---|
| Spreadsheet what-if | You type in a guess for how much sales will change | Quick margin checks | The answer is only as good as your guess |
| Elasticity-based simulator | Estimated from your own past prices and sales | Products with sales history and some past price changes | Needs price variation in the data to be reliable |
| Survey-based (conjoint) simulator | Customer choices in a structured survey | New products and feature-and-price trade-offs | Stated choices tend to overstate what people will pay |
| Enterprise scenario planning | Demand, competitor and cross-product models together | Large retailers modeling whole categories | Cost, setup time and data requirements |
Survey-based simulators are well established in market research. Sawtooth Software's choice simulator, for example, uses conjoint survey results to estimate the share of customers who'd choose each product at different prices and feature sets. The caution is that what people say in surveys isn't quite what they do: a 2020 meta-analysis by Schmidt and Bijmolt covering 77 studies found hypothetical willingness to pay was 21% above real willingness to pay on average. Simulations built on survey data should be read with that bias in mind; the trade-off is explored in price survey vs price testing.
Worked Example: Simulating Four Prices
A product sells for $30, costs $12, and sells 500 units a month, for $9,000 of monthly profit. An elasticity-based simulator estimates its price elasticity at −1.8, with a plausible range of −1.4 to −2.2. Here's what it predicts for four prices under each value:
| Price | Profit if elasticity is −1.4 | Profit if −1.8 (central estimate) | Profit if −2.2 |
|---|---|---|---|
| $27 | $8,692 | $9,066 | $9,456 |
| $30 (current) | $9,000 | $9,000 | $9,000 |
| $33 | $9,188 | $8,845 | $8,514 |
| $36 | $9,297 | $8,643 | $8,035 |
The central estimate says a small cut to $27 is marginally better, by $66 a month. But look across the row. If the true elasticity is −1.4, raising to $36 would earn $297 more; if it's −2.2, cutting to $27 earns $456 more. The plausible range points in opposite directions, and the central estimate's gain is smaller than the uncertainty around it.
A tool that only showed the central estimate would recommend a price cut with false confidence. A tool that shows the range tells you the truth: this product needs more price variation in its data before anyone should move its price. The practical move is to hold, or run a small, controlled test, as covered in how to run a price A/B test the right way. The formula behind these numbers is explained in the price elasticity of demand formula.
See what Zorin's elasticity model says about your own catalog.
Start free trialWhat Makes a Pricing Simulator Trustworthy
- It learns from your data, not a default. A generic elasticity for "home goods" says little about your product. Uber's own data, for example, produced surge-pricing elasticities mostly between −0.4 and −0.6 in an analysis of almost 50 million ride requests, a range specific to that market that wouldn't transfer to a candle shop.
- It shows uncertainty. A range, a confidence score or both. Without it, you can't tell a strong recommendation from a guess.
- It separates promotions and stockouts. Otherwise a sale week or an out-of-stock month distorts the demand model.
- It simulates profit, not just revenue. Revenue can rise while profit falls: at $27 with an elasticity of −1.4, revenue rises from $15,000 to about $15,650 while profit drops to $8,692.
- It includes your real costs. Landed cost, fees and shipping, so the profit line is meaningful.
- It stays within realistic ranges. Simulating far outside the prices a product has actually sold at is extrapolation, and the model should warn you.
How to Use a Pricing Simulator, Step by Step
- Start with products that have history. Pick products with several months of sales and at least a few past price changes.
- Simulate small moves first. ±5% to ±10% from the current price, where the model has the most evidence.
- Read the profit column and the confidence together. Act on large expected gains with strong confidence; hold where confidence is weak.
- Apply the change and record it. The new price and its sales become fresh data for the model.
- Compare the prediction with what happened. After a few weeks, check actual units against the simulation. Consistent misses mean the model needs more data or something else changed.
Building the Demand Model From Your Own Sales
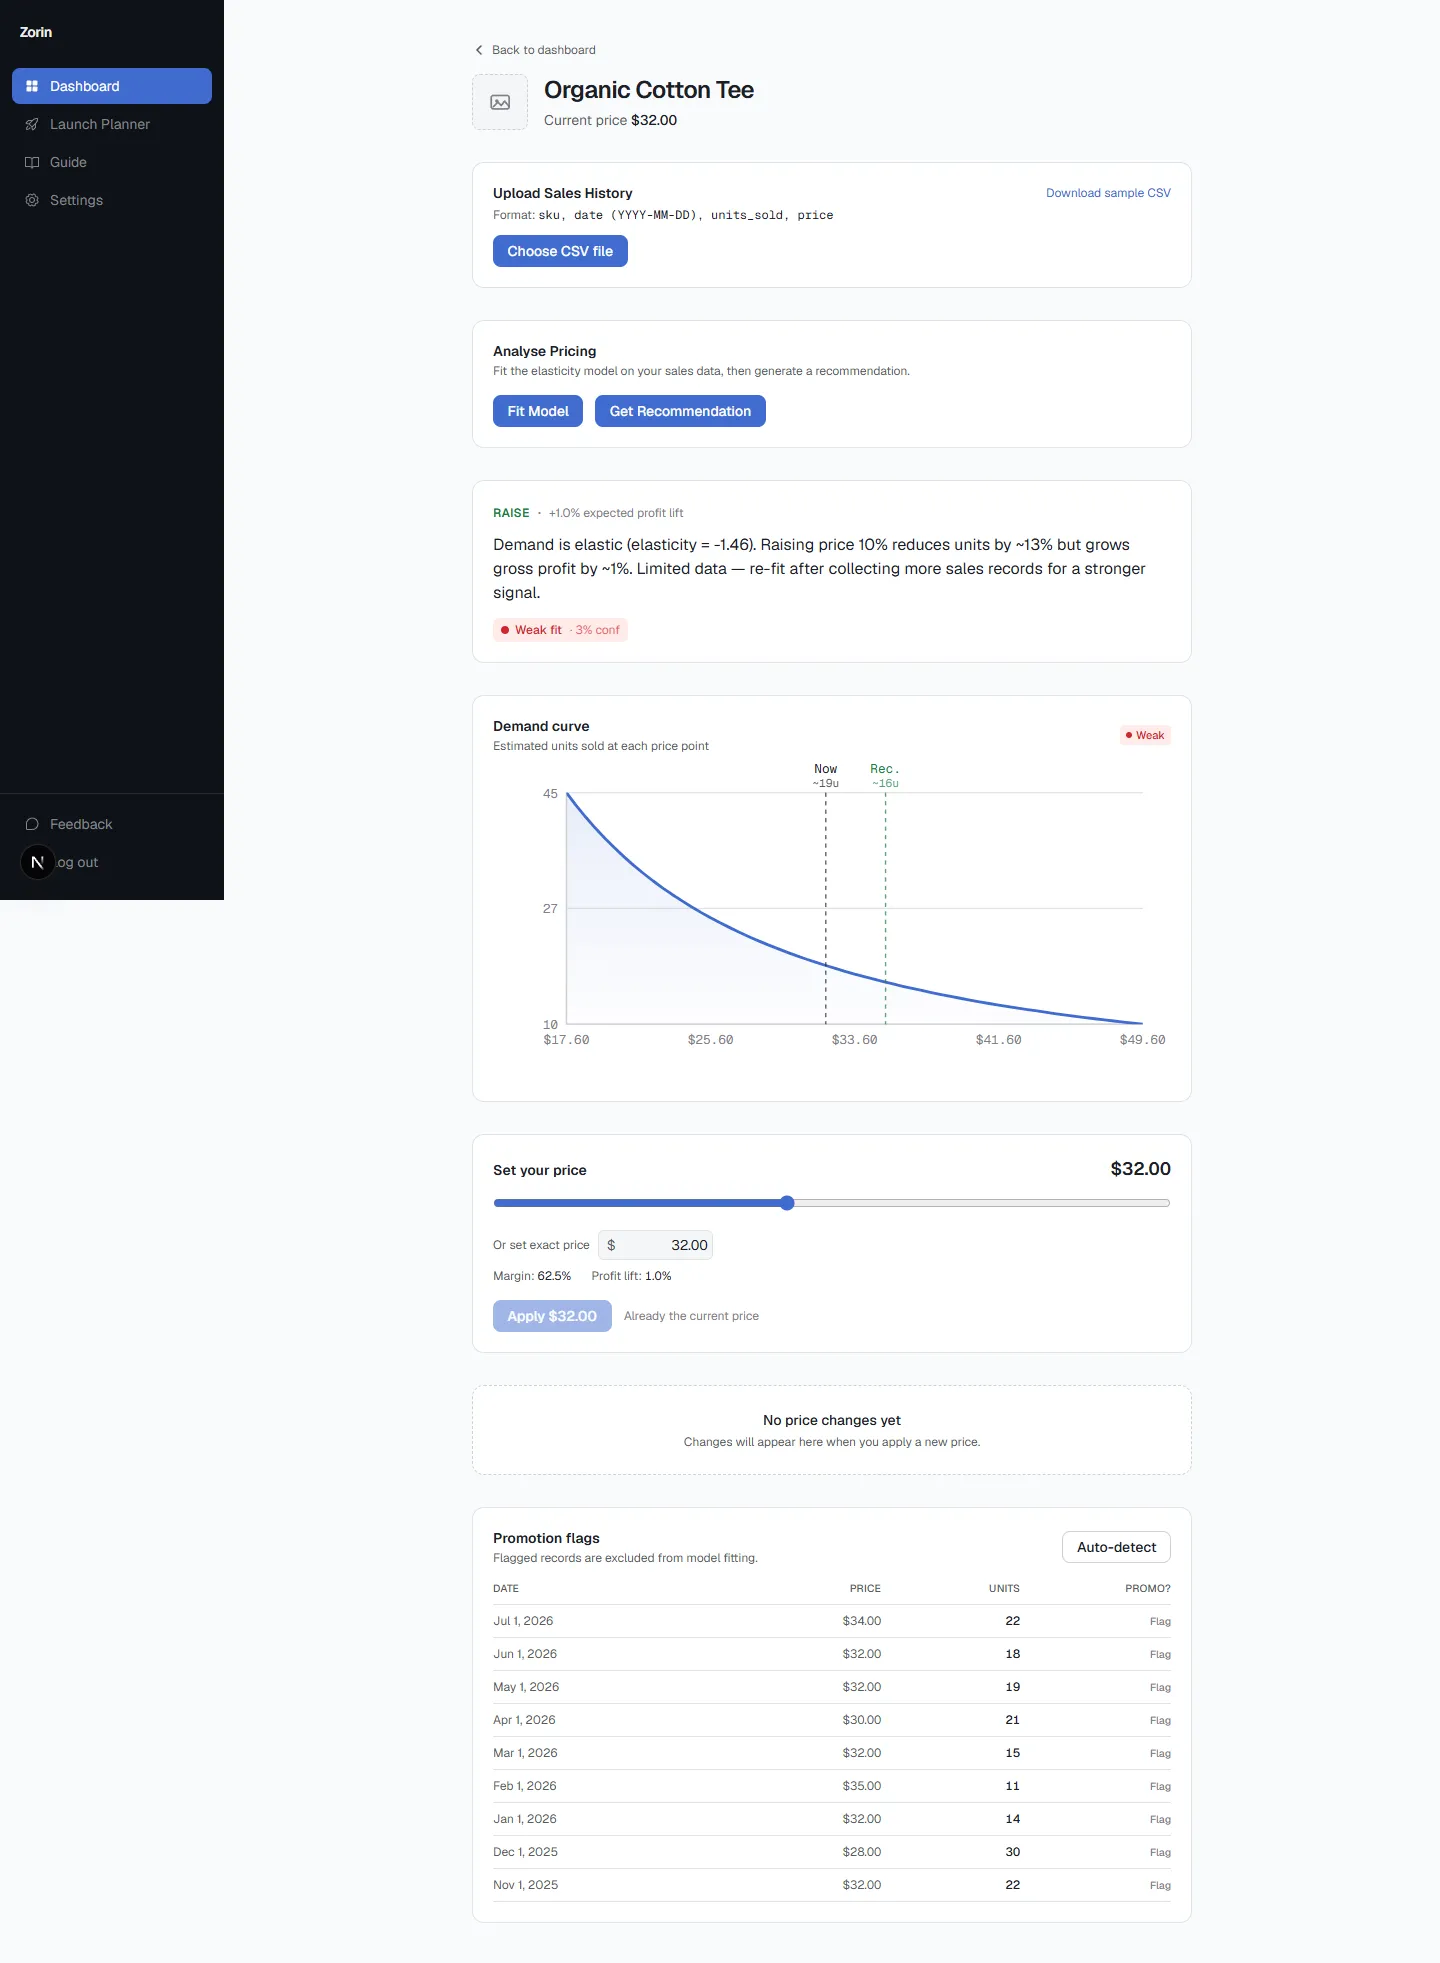
Zorin builds the demand model a simulation needs. For Shopify and WooCommerce stores it fits a price elasticity model for each product from your sales history, plots the demand curve, and recommends raise, lower or hold with an estimated profit impact and an R-squared based confidence score. A what-if price slider on each product shows the margin at any price you try before you apply it. When the data is thin, the confidence badge says so, which is exactly the situation in the worked example. For products with no history at all, its Van Westendorp survey gives you a stated-preference price range to start from, and the Launch Planner helps you set a first price using your costs and any competitor prices you record.
Key Takeaways
- A pricing simulation tool predicts units, revenue and profit at a new price before you change it.
- Its value depends on the demand model: your own sales history beats a typed-in guess or a generic benchmark.
- Survey-based simulators are useful for new products but can overstate willingness to pay, by 21% on average in one meta-analysis.
- In the worked example, the plausible elasticity range pointed to both a raise and a cut, so the right call was to hold.
- Trust simulators that show uncertainty, simulate profit and warn you when you go beyond the prices the data covers.
Frequently Asked Questions
What is a pricing simulation tool?
It's software that predicts what happens to units sold, revenue and profit if you change a price, using a model of how customers respond to price. It lets you test scenarios before changing live prices.
How accurate are pricing simulations?
They're as accurate as the demand model behind them. Simulators built on plenty of your own sales data, including past price changes, are much more reliable than ones built on guesses or generic benchmarks. Good tools show a confidence level so you know when to trust them.
Can I simulate pricing in a spreadsheet?
Yes, for simple margin checks. The weak point is that you have to guess how sales will respond. A spreadsheet can multiply your guess out accurately, but it can't tell you whether the guess is right.
What data do I need for a pricing simulator?
At minimum, prices, units sold and dates for each product, plus your costs. Several months of history with at least a few different prices gives the demand model something to learn from.
What is the difference between a pricing simulator and price optimization?
A simulator tells you what would happen at a price you choose. Price optimization searches across prices to find the one that best meets your goal, usually profit. Most optimization tools include a simulator underneath.
How do I simulate prices for a new product with no sales history?
Use a survey-based approach, such as a Van Westendorp or conjoint survey, to estimate an acceptable price range, then launch within it and let real sales data take over. Expect survey answers to run somewhat higher than real willingness to pay.
A pricing simulation tool is only as honest as its demand model and its uncertainty. Use one that learns from your own sales and tells you when it isn't sure. To simulate price changes on your catalog, start a free Zorin trial.
Written by Dexter
Dexter is part of the team at Zorin, building tools that help ecommerce merchants price with data instead of guesswork.
More in Pricing Tools & Software
View all →Best Competitor Price Tracking Software (2026)
The best competitor price tracking software compared: Google's free benchmarks, Prisync, Price2Spy, Omnia Retail and Competera, with prices and fit.
Pricefx Alternatives & Competitors: 5 Options
Pricefx alternatives by business type: Zilliant and Vendavo for B2B, Competera and Omnia Retail for retail, and Zorin for Shopify and WooCommerce stores.
MAP Pricing Software: Monitoring & Compliance Guide
What MAP pricing software does, the legal frame, when manual MAP monitoring stops working, a 7-step compliance process and questions to ask vendors.