How to Calculate Price Elasticity in WooCommerce
If you sell 100 units of a product each month at $20 and raise the price to $24, watching sales drop to 88 units tells you almost everything you need to know: your price elasticity of demand is roughly -0.70, meaning your customers are fairly insensitive to that price change. WooCommerce gives you more direct access to this kind of data than most platforms, through both its built-in Analytics reports and, if you want it, your store's raw database. This guide walks through where to actually find the numbers, how to run the calculation by hand, why a dynamic pricing plugin isn't measuring the same thing, and what changes, and doesn't, if you're used to thinking about this on Shopify.
Two Ways to Pull the Data: Analytics Export or Direct Database Access
WooCommerce merchants have a choice most other platforms don't offer as directly.
The straightforward path is WooCommerce's built-in Analytics: go to Analytics > Orders in your WordPress dashboard, set a date range covering a period where a price change happened, and export to CSV. This gives you order-level data you can filter down to a specific product's price and quantity sold over time, no plugin or developer required.
The second path is direct database access. Because WooCommerce runs on your own WordPress installation, you can query the underlying tables directly (order line items and their prices live in wp_woocommerce_order_items and related meta tables) if you're comfortable with SQL or have a developer who is. This removes the export step and can be faster for pulling data across many products at once, but it doesn't remove the actual modeling work, you still need to turn raw price-and-quantity rows into a clean before/after comparison per SKU.
For most merchants without a developer on hand, the Analytics export is the practical starting point. Database access is a genuine advantage WooCommerce has over more locked-down platforms, but it's a data-access shortcut, not an elasticity-calculation shortcut.
The Midpoint Formula, Worked on a Real Example
Price elasticity of demand measures how much quantity sold changes relative to how much price changes. The plain formula is percentage change in quantity divided by percentage change in price, but the midpoint method is worth using instead, since it gives the same result whether you're looking at a price increase or a price decrease, which a simple before/after calculation doesn't.
Using the example above: price moves from $20 to $24 (a change of $4), and quantity moves from 100 to 88 units (a change of -12).
| Step | Calculation | Result |
|---|---|---|
| % change in quantity (midpoint) | (88 - 100) / ((88 + 100) / 2) | -12.77% |
| % change in price (midpoint) | (24 - 20) / ((24 + 20) / 2) | 18.18% |
| Price elasticity of demand | -12.77% / 18.18% | -0.70 |
An elasticity of -0.70 (absolute value below 1) means demand is inelastic for this product: raising the price cost some volume, but not proportionally as much, so the price increase likely still grew total revenue and profit. A coefficient closer to or past -1 would mean the opposite, that the volume lost roughly matches or exceeds the price gain.
Dynamic Pricing Plugin or Elasticity Model: Not the Same Thing
WooCommerce has a genuinely large ecosystem of dynamic pricing plugins, and it's worth being precise about what they actually do, because it's not elasticity modeling.
Most WooCommerce dynamic pricing tools work by hooking into woocommerce_before_calculate_totals, a function that fires right before cart totals are calculated, and applying a rule you've already configured: a bulk discount at 10+ units, a role-based price for wholesale customers, a BOGO offer. That's rule automation. The plugin executes a pricing decision you already made, it doesn't tell you whether that decision is the right one for a given product.
An elasticity model does the opposite: it reads what actually happened when your price moved in the past and tells you how your customers responded, which is the input you'd want before deciding what any pricing rule should even say. A dynamic pricing plugin and an elasticity read are complementary, not competing, tools. One executes a pricing decision, the other informs it.
See what Zorin's elasticity model says about your own catalog.
Start free trialWhat Changes (and What Doesn't) Moving From Shopify to WooCommerce
The elasticity formula itself is completely platform-agnostic, percentage change in quantity divided by percentage change in price works identically whether your store runs on WooCommerce or Shopify. What actually differs is data access and data cleanliness.
WooCommerce's advantage is depth of access: full database and API access means, in principle, no data you can't eventually reach. Shopify's advantage is a more managed, consistent reporting layer out of the box, less powerful for a developer, but less setup for a non-technical merchant. Neither platform difference changes what the number means once you have it, a -0.70 elasticity reads the same way regardless of which platform generated the underlying order data.
One WooCommerce-specific wrinkle worth knowing: because the dynamic-pricing plugin ecosystem here is large and commonly used, promotional and rule-triggered price changes (a bulk discount, a role-based price) can end up mixed into your regular sales history more easily than on a platform with less plugin-driven pricing variation. That makes it especially important to exclude promotional periods before trusting an elasticity number calculated from WooCommerce order history.
Why Manual Calculation Breaks Down Past a Few SKUs
The math above works cleanly for one product with two clean data points, pulled either from an Analytics export or a direct query. It gets harder to trust at scale.
Run this by hand across 40 SKUs and three problems show up fast. Most stores don't have a clean two-point comparison for every product, some have had five price changes over the year, others none. A manual calculation gives you a number with no sense of how much to trust it, an elasticity from two data points after a traffic spike isn't the same quality of evidence as one from six months of steady sales with real price movement, but the plain formula treats them identically. And promotional periods, especially common given how many WooCommerce stores run dynamic-pricing plugins, quietly distort the read if they're not excluded first.
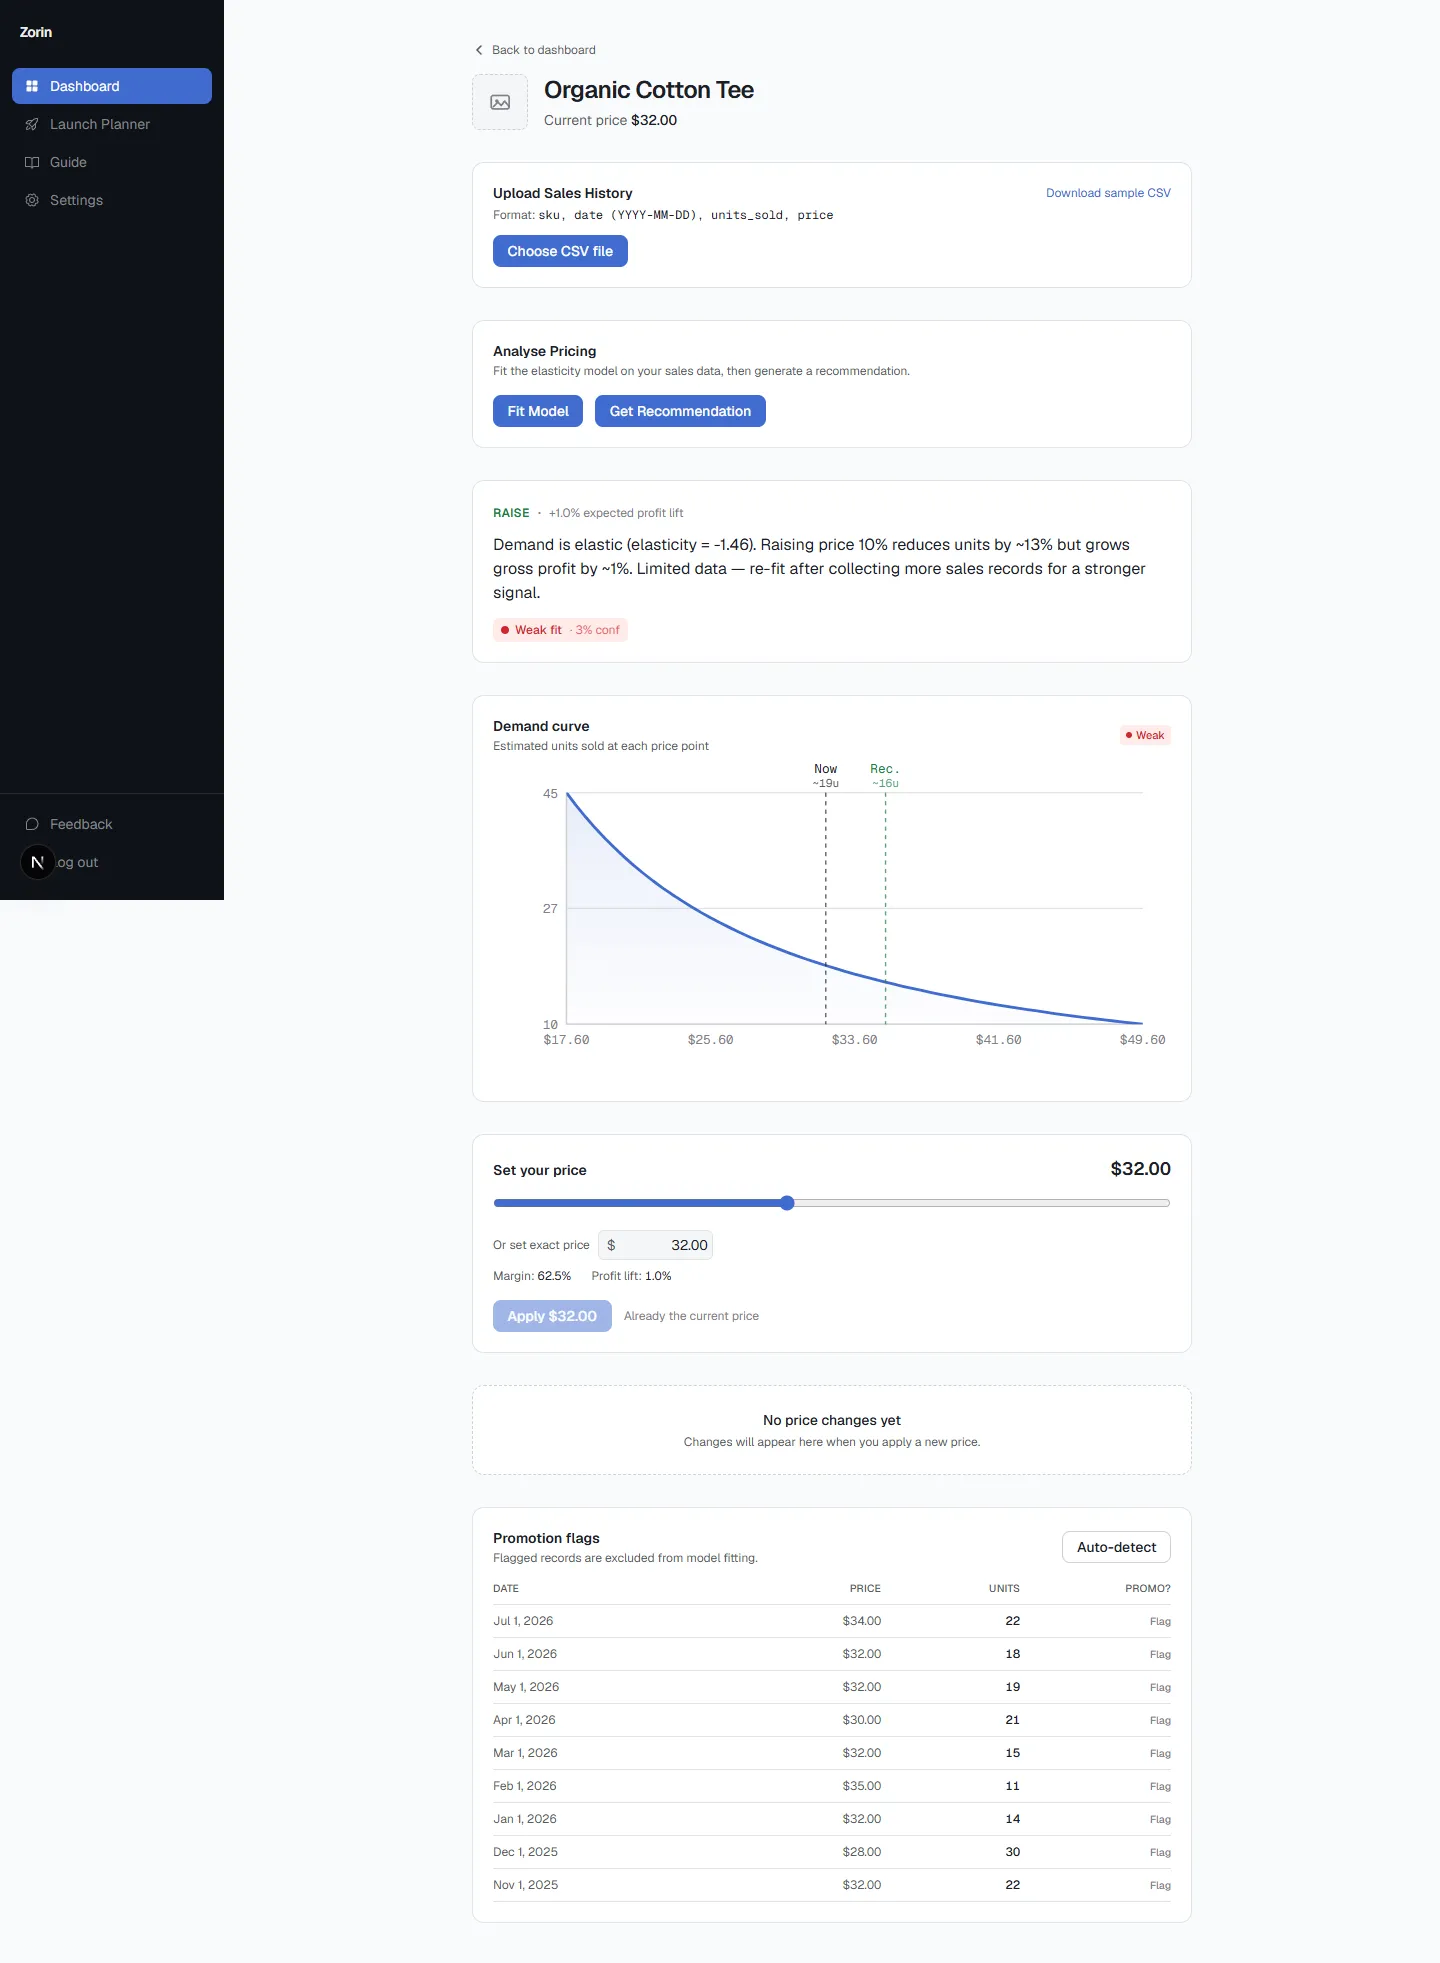
This is the gap Zorin closes. Connect your WooCommerce store (or upload a CSV export from Analytics > Orders if you'd rather not connect live) and Zorin fits a price elasticity model per SKU from your own historical price-and-quantity data, the same underlying math covered above, run automatically across your whole catalog. Each product gets a plain raise, lower, or hold recommendation, an estimated profit lift, and a confidence label reflecting how much real data and price variation actually support the number, so a thin-data SKU is never presented with the same certainty as a well-established one. Zorin also automatically detects likely promotional spikes, which matters especially on WooCommerce given how common rule-based pricing plugins are, and excludes them from the model fit before they can distort your baseline read.
Checking Your Result
The midpoint formula used above is the standard textbook method, explained step by step in OpenStax's free Principles of Economics textbook. Once you have a number, compare it with published estimates in our price elasticity by category reference: household appliances average around -0.35, soft drinks -1.06 to -1.37, and casual or athletic apparel around -2.86. A result far outside that range usually means the before-and-after periods weren't comparable, for example one of them included a sale.
Key Takeaways
- WooCommerce gives you two paths to the data you need: the built-in Analytics > Orders export (no developer required), or direct database access if you want to skip the export step.
- The midpoint formula, percentage change in quantity divided by percentage change in price, both calculated relative to the average of the two values, gives a consistent elasticity result regardless of whether price went up or down.
- A dynamic pricing plugin automates a rule you already chose. It doesn't calculate whether that rule is actually right for a given product, that's a separate question elasticity modeling answers.
- The elasticity formula itself doesn't change between WooCommerce and Shopify. What differs is data access and how easily promotional pricing gets mixed into your regular sales history.
- Manual calculation works for one product. Past a handful of SKUs, tracking data quality, confidence, and promotional contamination by hand stops being realistic, which is what automated elasticity modeling is for.
Frequently Asked Questions
How do I calculate price elasticity of demand for my WooCommerce store?
Pull price and quantity data for a product before and after a price change from WooCommerce's Analytics > Orders report (or your database directly), then apply the midpoint formula: percentage change in quantity divided by percentage change in price, both measured relative to the average of the two values.
Where do I find the sales data I need in WooCommerce?
Go to Analytics > Orders in your WordPress dashboard, set a date range spanning a price change, and export to CSV. This gives you order-level price and quantity data you can filter down to a specific product.
Does having database access make calculating elasticity easier on WooCommerce?
It removes the export step if you're comfortable with SQL, since you can query price and order data directly. It doesn't remove the actual modeling work, cleaning the data, excluding promotional periods, and running the calculation per product is the same effort either way.
What's the difference between a WooCommerce dynamic pricing plugin and an elasticity model?
A dynamic pricing plugin automates a pricing rule you've already configured, like a bulk discount or role-based price. An elasticity model reads your actual sales history and tells you how customers respond to price changes, which is the input that should inform what a pricing rule says in the first place.
Is price elasticity different on WooCommerce compared to Shopify?
The formula itself is identical on both platforms. What differs is data access (WooCommerce offers deeper database access) and data cleanliness, since WooCommerce's large dynamic-pricing plugin ecosystem makes it easier for promotional pricing to blend into regular sales history if it isn't excluded first.
What does a PED value below 1 mean for my WooCommerce product?
It means demand is inelastic: a price change produces a proportionally smaller change in units sold. That generally means there's room to raise the price without losing a disproportionate amount of volume.
Can I calculate this without a developer or data science background?
Yes. The Analytics > Orders export requires no technical skill, and the midpoint formula is arithmetic you can run in a spreadsheet with two price points and two quantity figures.
Why did my elasticity calculation look off?
The most common cause is a comparison window that includes a discount, coupon, or rule-based pricing-plugin promotion, which distorts the quantity figure. Use clean, comparable time periods, or exclude known promotional windows before calculating.
How much sales history do I need before the numbers are reliable?
There's no fixed cutoff, but more history with genuine price variation produces a more reliable estimate. This is why a confidence score matters more than the bare number, it tells you how much to trust a specific read rather than treating every estimate as equally certain.
Does Zorin work with WooCommerce the same way it works with Shopify?
Yes. You can connect your WooCommerce store for live sync or upload a CSV of your sales history, and Zorin fits the same per-SKU elasticity model either way, with automatic promotion detection and a confidence label on every recommendation.
The formula for price elasticity is simple arithmetic you can run on one product in a spreadsheet. Where it gets genuinely hard is doing it accurately across a real catalog, with promotional noise filtered out and a confidence level attached to every number. For the general version of this walkthrough, or if you're evaluating Shopify instead, see what price elasticity actually means and the Shopify-specific calculation guide. Connect your WooCommerce store and see your own catalog's elasticity read automatically, or start with the free WooCommerce profit margin calculator to check your current margins first.
Written by Dexter
Dexter is part of the team at Zorin, building tools that help ecommerce merchants price with data instead of guesswork.
More in Price Elasticity
View all →What Your Price Elasticity Score Actually Means
What your elasticity number means, how to know if it's solid enough to act on, and why products in the same category can have completely different scores.
How to Know If Your Prices Are Too High or Too Low
Declining sales and high close rates are lagging signals. Price elasticity tells you before you change anything, not after the damage is done.
Sales Dropped After a Price Increase? Here's Why
Sales dropped after a price increase? It usually comes down to one of three causes, each with a different fix. How to tell which one hit your store.