How to Calculate Price Elasticity on Shopify
Price elasticity of demand (PED) tells you how much a product's sales volume changes when its price changes, and you calculate it by dividing the percentage change in quantity sold by the percentage change in price. You can work this out by hand for a single product using two data points from Shopify Analytics, or you can run it across your whole catalog automatically. This walks through both.
Doing this the manual way for a dozen best sellers, one spreadsheet tab per product, makes clear exactly where it gets tedious: not the math, the data pulling. The formula itself takes ten seconds. Getting clean before-and-after numbers out of your own store, and knowing whether you can trust the result, is where most merchants get stuck. That's also exactly the gap Zorin is built to close, worth pointing out where it fits along the way.
The Price Elasticity of Demand Formula
Price elasticity of demand measures how sensitive your customers are to a price change. The formula is:
PED = % change in quantity sold ÷ % change in price
If a 10% price increase causes a 15% drop in units sold, your PED is -1.5. Economists usually report the absolute value, so you'd call this product's elasticity 1.5.
Each piece of that formula comes from your own order data:
- % change in quantity sold: (new quantity - old quantity) ÷ old quantity
- % change in price: (new price - old price) ÷ old price
You don't need a data science background to calculate this. You need two clean data points: a baseline price and quantity, and a second price and quantity after a change.
The Midpoint Formula (More Accurate for Small Sample Sizes)
The simple formula above has a known flaw: it gives you a different answer depending on whether you treat the price increase or the price decrease as your starting point. If you're working with a short sales history or only one price change, that inconsistency can meaningfully skew your number.
The midpoint, or arc elasticity, formula fixes this by averaging the two price points and two quantity points instead of picking one as the base:
PED = [(Q2 - Q1) ÷ ((Q2 + Q1) ÷ 2)] ÷ [(P2 - P1) ÷ ((P2 + P1) ÷ 2)]
Where Q1 and P1 are your original quantity and price, and Q2 and P2 are the new quantity and price. It's a few more steps, but it removes the directional bias, which matters most when you're working with limited data, exactly the situation most independent Shopify merchants are in.
Step-by-Step: Calculating PED for a Shopify Product
Here's the actual workflow, using a real-shaped example.
- Pull your baseline data. In Shopify Admin, go to Analytics, then Reports, and look for your product performance or sessions-by-product report to find units sold at your current price over a defined period, ideally 30 days or more so a short-term spike doesn't distort the read.
- Make, or find, a price change. This can be a deliberate test or a price change you already made for another reason. Either way, you need the exact price and the exact date it changed.
- Pull the same window post-change. Use a comparable time period after the change, same length, and ideally similar seasonality, so you're comparing like to like.
- Run the formula.
Say you sell a skincare serum at $32 and typically move 500 units a month. You raise the price 12.5% to $36, and the following month you sell 400 units, a 20% drop.
| Price | Units sold | |
|---|---|---|
| Before | $32 | 500 |
| After | $36 | 400 |
PED = -20% ÷ 12.5% = -1.6
Taking the absolute value, this product has an elasticity of 1.6. Because that's greater than 1, demand for this serum is elastic, the 12.5% price increase produced a disproportionately larger drop in units sold.
Elastic, Inelastic, or Unitary: What Your Number Means
Once you have a PED value, here's what it tells you about how to price that product:
| Elasticity value | Classification | What it means |
|---|---|---|
| PED = 0 | Perfectly inelastic | Demand doesn't move regardless of price. Rare in ecommerce, typical of true necessities. |
| 0 < PED < 1 | Inelastic | Demand shifts proportionally less than price. You likely have room to raise price without losing much volume. |
| PED = 1 | Unitary elastic | Demand shifts exactly in proportion to price. Revenue stays roughly flat either direction. |
| PED > 1 | Elastic | Demand shifts more than proportionally to price. Cutting price could grow revenue, raising it risks a steep volume drop. |
| PED = infinity | Perfectly elastic | Any price increase collapses demand to zero. Typical of commodity products with easy substitutes. |
A product with PED of 1.6, like the serum above, is telling you customers have alternatives and are watching the price. A product sitting at 0.4 is telling you the opposite, raising price is unlikely to cost you many sales.
A/B Testing vs. Historical Sales Data: Which Method Is More Reliable
There are two main ways to gather the price-and-quantity data this formula needs, and they have different tradeoffs.
Historical sales data uses price changes you've already made, deliberately or not, and compares before-and-after windows. It's the faster method since you don't need to run anything new, but it's vulnerable to contamination: seasonality, a marketing push, a competitor's stockout, or a holiday can all shift demand at the same time your price changed, and you won't be able to separate the two effects cleanly.
A/B testing splits your traffic into two cohorts at the same time and shows each cohort a different price. This is the statistically cleaner method because both groups experience the same seasonality, the same marketing conditions, and the same external environment simultaneously, so the only real variable is price. The tradeoff is that it takes deliberate setup, typically a split-URL or server-side experiment, and needs enough concurrent traffic to reach a meaningful sample, generally a minimum of a couple hundred conversions per variant before the result is trustworthy.
If you're working from historical data, avoid comparing two sequential periods weeks apart, since anything that changed in between, a sale, a season, a viral moment, will bias your number. Concurrent A/B testing avoids that problem entirely, at the cost of needing enough traffic to run it.
See what Zorin's elasticity model says about your own catalog.
Start free trialWhy Manual Calculation Breaks Down Past a Few SKUs
The math above works cleanly for one product with two clean data points. It gets a lot harder to trust at scale.
Run this by hand across 40 SKUs and you hit three real problems. First, most stores don't have a clean two-point comparison for every product, some have five price changes over a year, others have none. Second, a manual calculation gives you a number with no sense of how much to trust it, a PED derived from two data points after a big traffic spike is not the same quality of evidence as one derived from six months of steady sales with several price movements, but the plain formula treats them identically. Third, promotional periods quietly distort the read: if your before or after window includes a discount code or a flash sale, your elasticity number is really measuring discount sensitivity, not baseline price sensitivity, and nothing in the manual formula flags that for you.
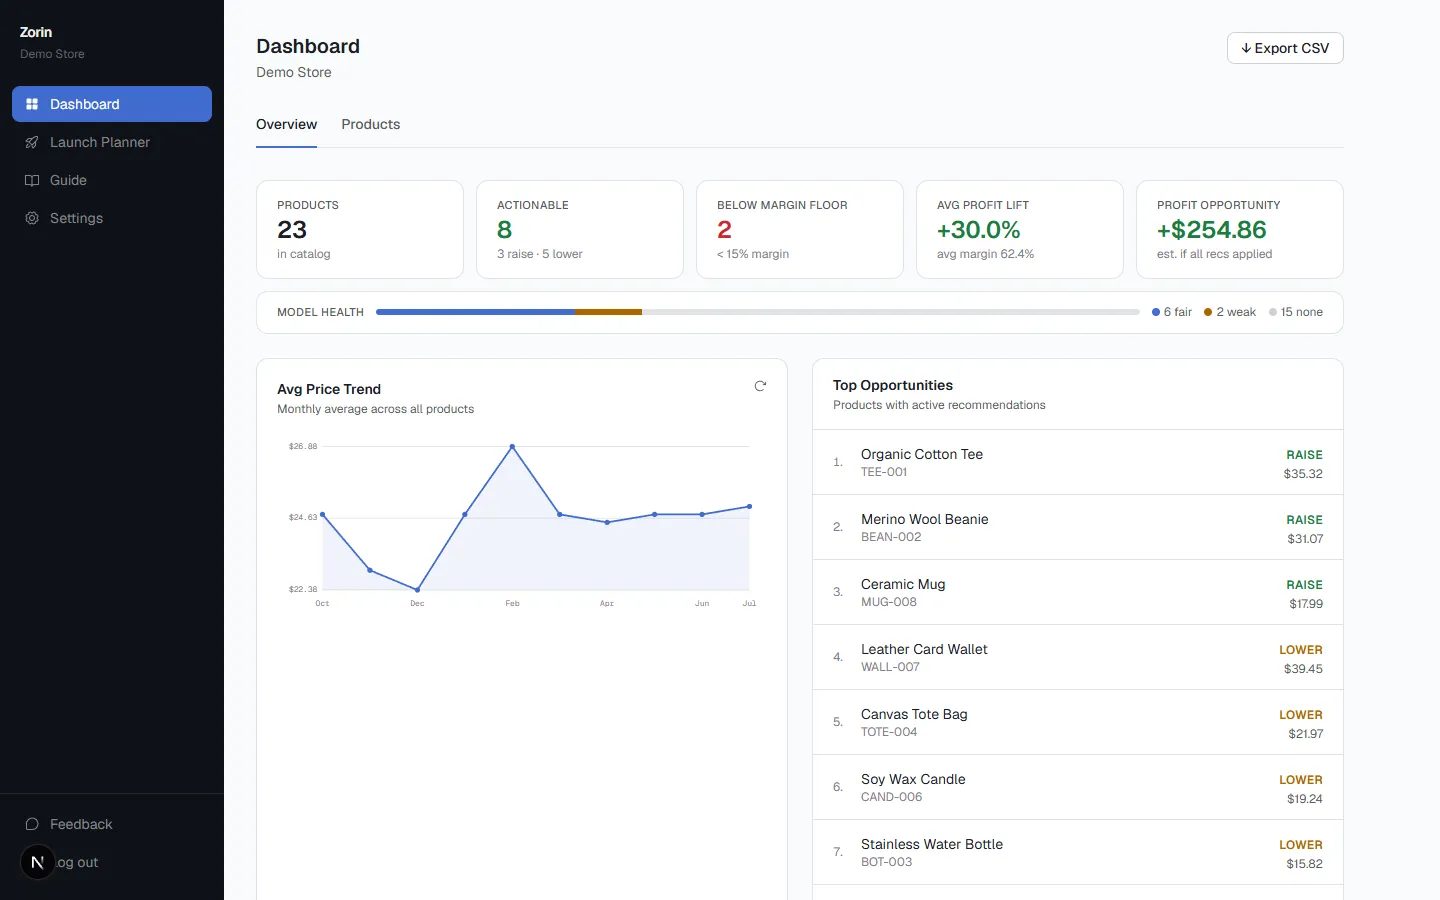
This is the exact gap Zorin was built to close. Instead of computing PED by hand, product by product, Zorin connects to your Shopify or WooCommerce store, or reads an uploaded CSV of sales history, and fits a price elasticity model per SKU using your own historical price-and-quantity data. Each product gets a plain raise, lower, or hold recommendation, an estimated profit lift, and a confidence label that reflects how much real data and price variation actually support the number, so a thin-data SKU is never presented with the same certainty as a well-established one. It also automatically detects likely promotional spikes in your sales history and excludes them from the model fit, solving the exact discount-contamination problem a manual calculation can't catch. It doesn't watch or match competitor prices, every recommendation is grounded in what your own customers have actually done.
Is This Worth It for a Small Store, or Only Large Catalogs
Elasticity analysis isn't gated by store size, it's gated by data. What actually matters is whether you have enough sales history with enough price movement in it for the formula to have something to read. A useful rough bar: at least 10 to 20 SKUs, roughly six months of sales history, and some real price variation somewhere in that history, a formula can't tell you anything about price sensitivity if your price never moved.
A 15-SKU store that's changed a few prices over the past year has more usable elasticity signal than a 300-SKU store that's never touched a single price tag. Catalog size affects how much manual effort this takes if you're doing it by hand in a spreadsheet, one calculation per SKU adds up fast, but it doesn't affect whether the underlying math is valid. This is also where the case for automation gets stronger even for smaller stores: reading 15 SKUs by hand is tedious but doable in an afternoon, reading 150 by hand generally doesn't happen at all, which is usually how "probably fine" pricing habits take root in the first place.
If you'd like to see this calculated automatically across your own catalog rather than product by product in a spreadsheet, you can connect your Shopify store or connect WooCommerce and Zorin will fit an elasticity model to your actual sales history. You can also check your current margins first with the free Shopify profit margin calculator before deciding where to test a price change. If you want to compare Zorin against the rest of the elasticity-tool category first, a roundup of the tools that actually calculate elasticity covers the field. This guide covered getting the data out of Shopify specifically and running the calculation on it; the formula on its own, platform-agnostic and worked through a plain example, is worth a read if you sell across more than one channel.
Checking Your Result
The midpoint formula used above is the standard textbook method, explained step by step in OpenStax's free Principles of Economics textbook. Once you have a number, compare it with published estimates in our price elasticity by category reference: household appliances average around -0.35, soft drinks -1.06 to -1.37, and casual or athletic apparel around -2.86. A result far outside that range usually means the before-and-after periods weren't comparable, for example one of them included a sale.
Key Takeaways
- PED = % change in quantity sold ÷ % change in price; a result greater than 1 (absolute value) means demand is elastic.
- The midpoint formula removes directional bias and is more reliable with limited data.
- Concurrent A/B testing is statistically cleaner than comparing sequential historical periods, but needs enough simultaneous traffic to be valid.
- Manual PED calculation works for one product; it breaks down at scale because it can't flag thin data or promotional distortion.
- Elasticity analysis is gated by data (SKU count, sales history, price variation), not by store size.
Frequently Asked Questions
What's the best software for measuring price elasticity in an ecommerce store?
It depends on the mechanism you want. Competitor repricers watch rival prices, not your own demand. Rule-based plugins apply fixed discount logic you configure yourself. Tools like Zorin instead fit an elasticity model from your own Shopify or WooCommerce sales history, which is the only data source that reflects how your specific customers respond to price.
How do I calculate price elasticity of demand for my Shopify products?
Pull a baseline price and quantity sold from Shopify Analytics, apply or find a price change, pull the same data after the change, then divide the percentage change in quantity by the percentage change in price. Use the midpoint formula if you're working with limited data.
What's the most reliable way to test price elasticity, A/B testing or historical sales data?
Concurrent A/B testing is statistically cleaner because both price groups experience the same conditions at the same time. Historical data comparison is faster to set up but risks contamination from seasonality, promotions, or other changes that happened in the same window.
Is price elasticity analysis worth it for a small ecommerce store, or only for large catalogs?
It's worth it for small stores too. What matters is having roughly 10 to 20+ SKUs, several months of sales history, and some real price variation in that history, not overall catalog size or revenue.
Which pricing tools use AI to model demand elasticity across a whole product catalog?
Zorin fits a log-log regression per SKU from your own sales history and returns a raise, lower, or hold recommendation with an estimated profit lift and a confidence score, applied across your full catalog rather than one product at a time.
What does a PED value greater than 1 mean?
It means demand is elastic: a price change produces a proportionally larger change in units sold. Customers likely have accessible substitutes and are price-sensitive on that product.
Can I calculate price elasticity without a data science background?
Yes. The core formula is basic arithmetic using two price points and two quantity figures you can pull directly from Shopify Analytics.
Why did my elasticity calculation give a strange or inconsistent result?
The most common cause is a comparison window that includes a promotion, discount code, or seasonal spike, which distorts the quantity figure. Use clean, comparable time periods, or use the midpoint formula to reduce sensitivity to which point you treat as the baseline.
Does Zorin compare my prices to competitors?
No. Zorin's elasticity model reads only your own sales history, not competitor prices. That mechanism was deliberately left out of the product in favor of reading first-party demand data, since your customers, costs, and brand aren't the same as anyone else's.
How much sales history do I need before elasticity numbers are trustworthy?
There's no fixed cutoff, but more history with real price variation produces a more reliable estimate. This is why a confidence score matters: it tells you how much to trust a given number rather than presenting every estimate with the same certainty.
The formula for price elasticity of demand is simple enough to run by hand on one product in a spreadsheet. Where it gets genuinely hard is doing it accurately across a real catalog, with promotions filtered out and a confidence level attached to every number. If you want to start a free trial and see your own catalog's elasticity read automatically, Zorin will fit the model directly from your Shopify or WooCommerce sales history. Running WooCommerce specifically? here's the same walkthrough using WooCommerce's own Analytics export and database access.
Written by Dexter
Dexter is part of the team at Zorin, building tools that help ecommerce merchants price with data instead of guesswork.
More in Price Elasticity
View all →How to Calculate Price Elasticity in WooCommerce
Where to find the data in WooCommerce Analytics, the midpoint formula on a real example, and why a pricing plugin isn't an elasticity read.
What Your Price Elasticity Score Actually Means
What your elasticity number means, how to know if it's solid enough to act on, and why products in the same category can have completely different scores.
How to Know If Your Prices Are Too High or Too Low
Declining sales and high close rates are lagging signals. Price elasticity tells you before you change anything, not after the damage is done.