Cross Price Elasticity of Demand (With Examples)
Cross price elasticity of demand measures how much the demand for one product changes when the price of a different product changes. The formula is the percentage change in quantity demanded of product A divided by the percentage change in the price of product B. A positive result means the two are substitutes (a rival's price cut pulls sales away from you), a negative result means they are complements (cheaper printers sell more ink), and a result near zero means they are unrelated.
What Cross Price Elasticity of Demand Measures
Ordinary price elasticity of demand looks at one product: how its sales respond when its own price moves. Cross price elasticity looks sideways. It asks how sales of your product respond when the price of something else moves, whether that is a competitor's version of the same item or another product in your own catalog.
For an online store, that sideways view answers practical questions. If a rival drops their price, how many sales do you lose? If you discount a hero product, do accessories ride along? If you raise the price of one flavor, do customers switch to another flavor you also sell, or leave?
The Cross Price Elasticity of Demand Formula
The formula is:
Cross price elasticity (XED) = % change in quantity demanded of product A ÷ % change in price of product B
Percentage change is the new value minus the old value, divided by the old value. If the price changes are large, the midpoint method (dividing by the average of the old and new values) gives a more symmetric answer, the same refinement explained in our guide to the price elasticity of demand formula.
How to Interpret the Result
| Cross price elasticity | Relationship | What it means | Ecommerce example |
|---|---|---|---|
| Positive, large (above about +1) | Strong substitutes | Customers switch easily when the other product gets cheaper | Two near-identical phone cases from different sellers |
| Positive, small (0 to about +1) | Weak substitutes | Some switching, but loyalty or differences hold most buyers | A premium brand vs a budget alternative |
| Around zero | Independent | One price has no real effect on the other product | Candles and phone chargers |
| Negative | Complements | The products are bought together, so one getting cheaper lifts the other | Espresso machines and coffee pods |
The sign tells you the relationship; the size tells you its strength. A cross elasticity of +2.0 means a 10% cut in a rival's price takes about 20% of your volume. A cross elasticity of +0.2 means the same cut costs you about 2%.
Worked Examples
Substitutes: a competitor cuts their price
You sell a stainless steel water bottle for $30 and move 300 units a month. A competitor with a very similar bottle cuts their price from $32 to $27.20, a 15% drop. The next month, with nothing else changed, you sell 255 bottles.
- Your quantity change: (255 − 300) ÷ 300 = −15%
- Their price change: (27.20 − 32) ÷ 32 = −15%
- XED = −15% ÷ −15% = +1.0
Positive, so the bottles are substitutes, and fairly strong ones: every 1% the rival cuts costs you about 1% of your volume. At a $12 profit per bottle, those 45 lost units cost you $540 a month.
Complements: you discount your own hero product
You sell a pour-over kettle at $60 (cost $30) and filter papers at $8 a pack (cost $4). You cut the kettle 10% to $54. Kettle sales rise from 200 to 230 a month, and filter sales rise from 400 to 440 packs.
- Filter quantity change: (440 − 400) ÷ 400 = +10%
- Kettle price change: −10%
- XED of filters with respect to kettle price = +10% ÷ −10% = −1.0
Negative, so they are complements. Now the profit check, which is where cross elasticity earns its keep:
| Before | After the kettle discount | Change | |
|---|---|---|---|
| Kettle profit | 200 × $30 = $6,000 | 230 × $24 = $5,520 | −$480 |
| Filter profit | 400 × $4 = $1,600 | 440 × $4 = $1,760 | +$160 |
| Total | $7,600 | $7,280 | −$320 |
The complement effect is real, but it only recovers a third of what the discount gave away. Looking at the kettle alone, you'd see a $480 loss; looking at the filters alone, a $160 win. The cross effect tells you the true net, which here is still negative. Discounting a product to drive add-on sales only pays when the add-ons carry enough margin and enough volume to cover the gap, the same logic behind pricing bundles without giving away your margin.
See what Zorin's elasticity model says about your own catalog.
Start free trialReal-World Evidence
Amazon vs Barnes & Noble online. Economists Judith Chevalier and Austan Goolsbee built a way to estimate demand from public sales ranks and applied it to about 20,000 books sold at Amazon and BN.com. In their NBER study, later published in Quantitative Marketing and Economics, demand at BN.com had an own-price elasticity close to −4 and a very high cross price elasticity with Amazon's price. At Amazon, own-price elasticity was around −0.6 and the cross price elasticity was relatively small. In plain terms, BN.com shoppers switched readily when Amazon was cheaper, while Amazon shoppers mostly stayed put when BN.com was cheaper. The same product can have very different cross elasticities depending on which store it's sold in.
Gasoline and cars. A study by Meghan Busse, Christopher Knittel and Florian Zettelmeyer, "Pain at the Pump", found that a $1 rise in the gasoline price changed the market share of the most fuel-efficient quarter of new cars by +20% and the least fuel-efficient quarter by −24%. Fuel is a complement to driving, so a price rise for gas pushes demand away from thirsty cars (negative cross effect) and toward efficient ones (positive cross effect). One price change moved two groups of products in opposite directions.
How Online Stores Use Cross Price Elasticity
- Size your competitive exposure. A high positive cross elasticity with a named competitor means you can't ignore their price moves. A low one means your brand, reviews or shipping speed protect you, and matching every cut would give away margin for nothing. Our guide to competitive pricing strategy covers when to sit below, at or above the market.
- Choose what to discount. Discount the product with strong complements and healthy add-on margins, not the one that sells alone.
- Watch for cannibalization in your own catalog. Two of your own products with a high positive cross elasticity steal from each other. A price cut on one may just move sales from its sibling, and total profit can fall even as the discounted product "wins".
- Read your own-price elasticity carefully. If a competitor cut their price in the same month you changed yours, part of your sales change came from them, not from you. Separate the two before concluding your product is price-sensitive.
The Limits of Cross Price Elasticity
Cross elasticities are harder to estimate than own-price elasticities. You need prices for the other product over time, which for competitors means reliable tracking, and many things change at once in a real store. The numbers also aren't symmetric: as the Amazon and BN.com study shows, how much A responds to B's price is not the same as how much B responds to A's. Treat any single estimate as a directional read.
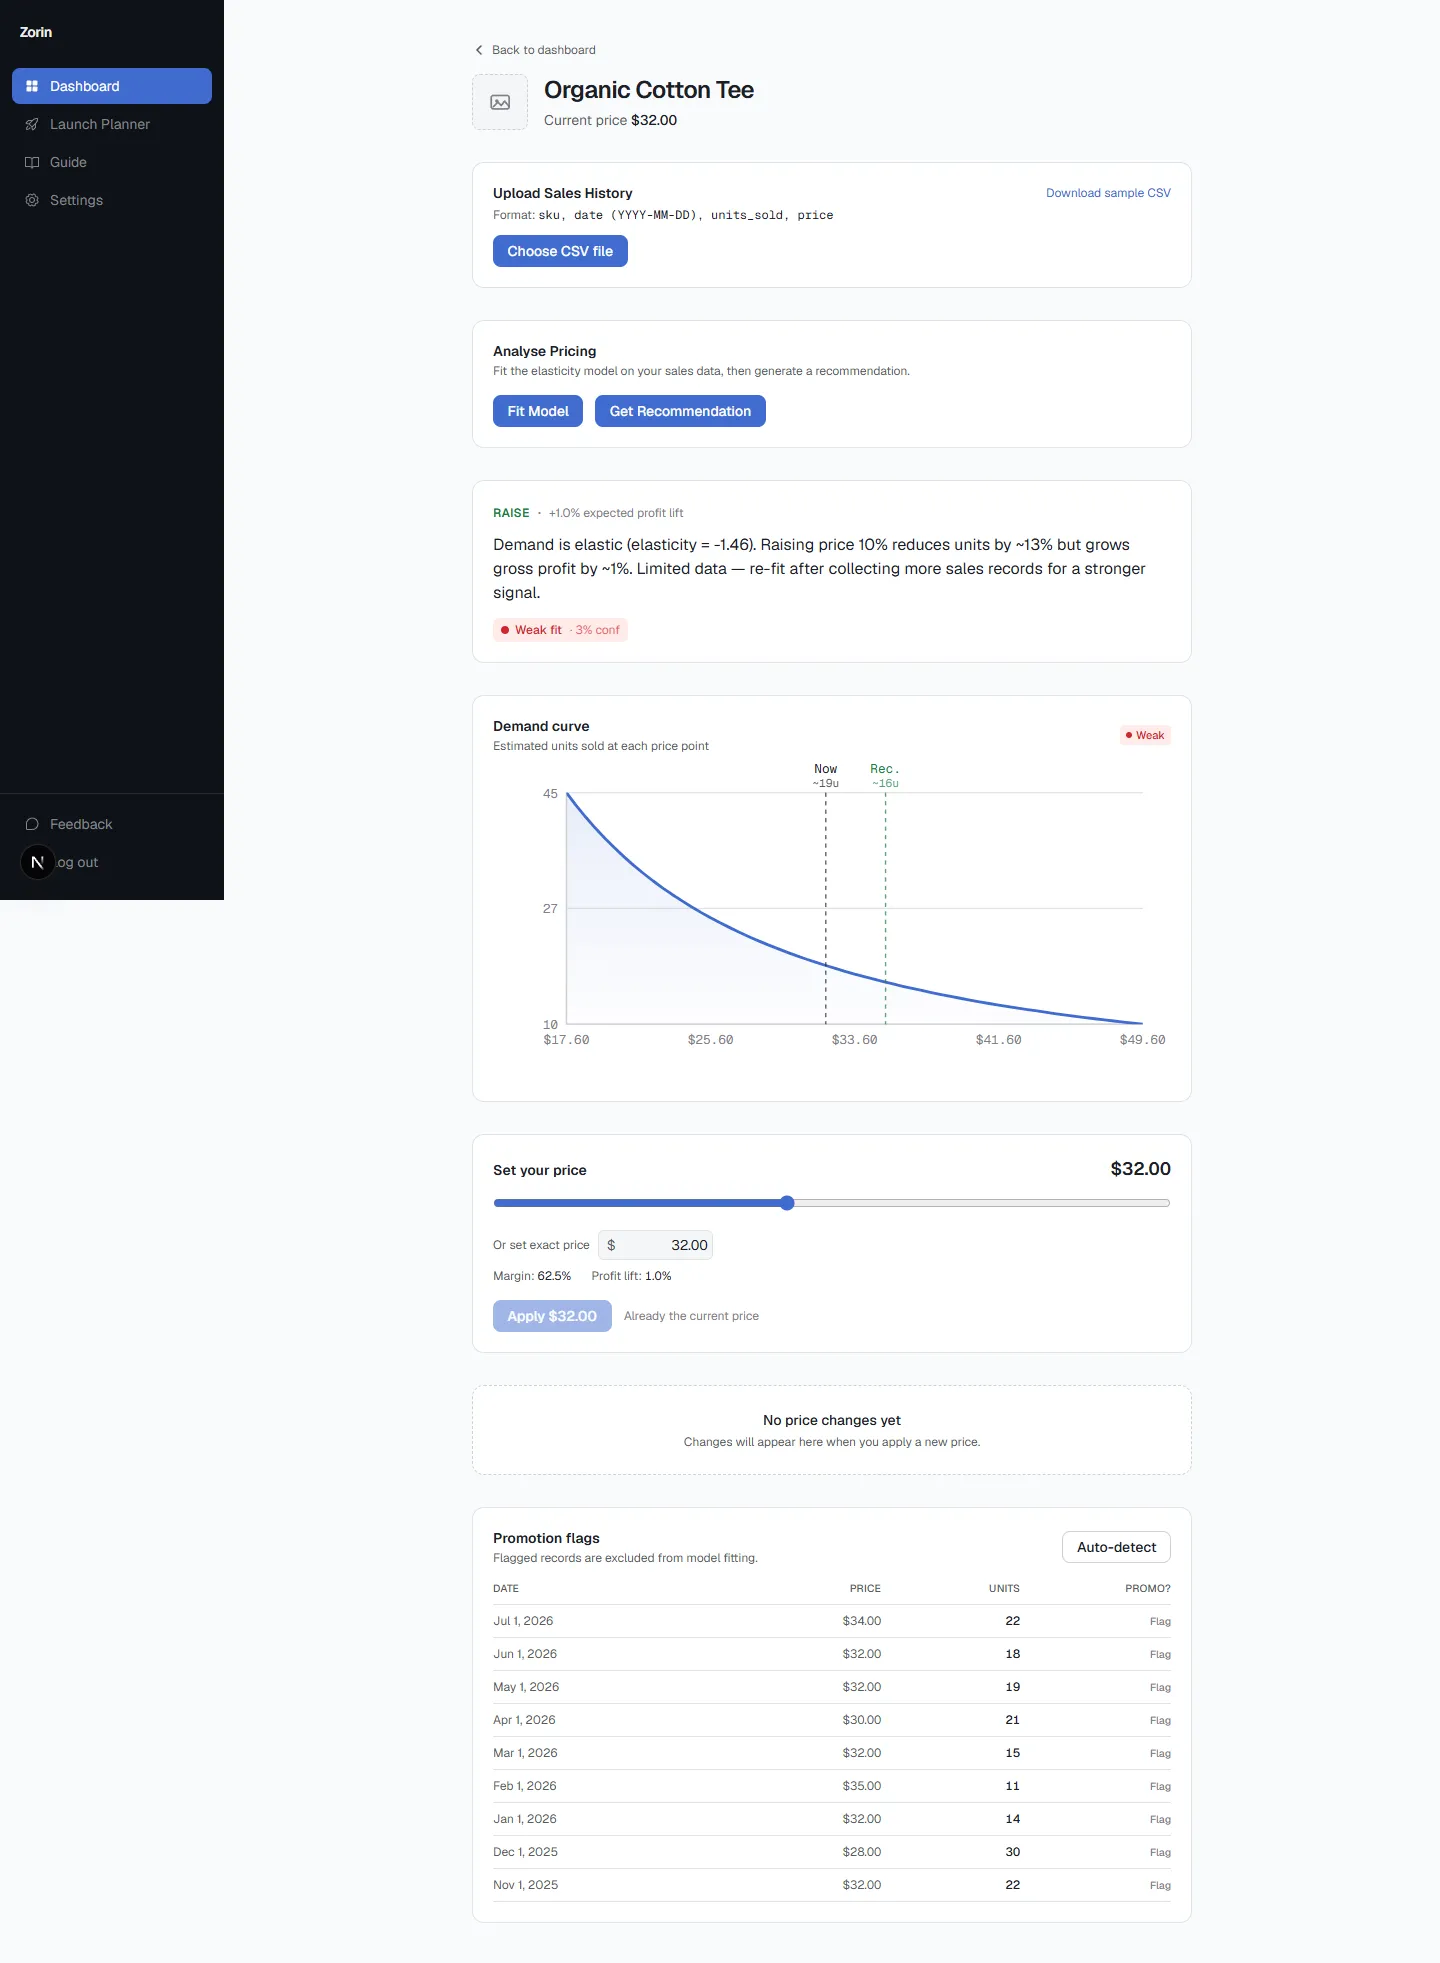
For most small stores, the most useful starting point is still each product's own price elasticity, measured cleanly. That's what Zorin does: it reads your Shopify or WooCommerce sales history and fits a demand model for each product, with a confidence score so you know how far to trust it. Flagging past promotions keeps sale weeks from distorting the read, and you can record known competitor prices per product so you have that context next to the recommendation.
Key Takeaways
- Cross price elasticity of demand = % change in quantity of product A ÷ % change in price of product B.
- Positive means substitutes, negative means complements, and near zero means unrelated products.
- BN.com's cross elasticity with Amazon was very high while Amazon's with BN.com was small, so cross effects are rarely symmetric.
- A $1 gas price rise shifted new car shares by +20% for the most efficient cars and −24% for the least efficient.
- Always check the combined profit: in the kettle example, the complement lift recovered only a third of the discount's cost.
Frequently Asked Questions
What is cross price elasticity of demand?
It measures how the quantity demanded of one product changes when the price of another product changes. It's calculated as the percentage change in quantity of product A divided by the percentage change in price of product B.
What does a positive cross price elasticity mean?
The products are substitutes. When the other product's price rises, demand for yours rises too, because some buyers switch. The larger the number, the more easily customers move between the two.
What does a negative cross price elasticity mean?
The products are complements, bought together. When one gets cheaper, demand for the other rises, as with game consoles and games, or printers and ink.
What is the difference between price elasticity and cross price elasticity?
Price elasticity measures how a product's sales respond to its own price. Cross price elasticity measures how its sales respond to the price of a different product, such as a competitor's version or a complementary item.
Is cross price elasticity the same in both directions?
No. Research on Amazon and BN.com found BN.com's demand was very sensitive to Amazon's price, while Amazon's demand barely responded to BN.com's price. Brand strength and loyalty make the relationship lopsided.
How do I calculate cross price elasticity for my store?
Record your product's unit sales before and after another product's price changed, and the size of that price change. Divide the percentage change in your sales by the percentage change in the other price, and make sure nothing else, such as a promotion or stockout, changed in the same period.
Cross price elasticity tells you how connected your products are, to each other and to your competitors. It's most useful once you already know how each product responds to its own price. To see that number for every product in your catalog, start a free Zorin trial and connect your store.
Written by Dexter
Dexter is part of the team at Zorin, building tools that help ecommerce merchants price with data instead of guesswork.
More in Price Elasticity
View all →How to Calculate Price Elasticity in WooCommerce
Where to find the data in WooCommerce Analytics, the midpoint formula on a real example, and why a pricing plugin isn't an elasticity read.
What Your Price Elasticity Score Actually Means
What your elasticity number means, how to know if it's solid enough to act on, and why products in the same category can have completely different scores.
How to Know If Your Prices Are Too High or Too Low
Declining sales and high close rates are lagging signals. Price elasticity tells you before you change anything, not after the damage is done.