The Real Cost of Pricing Products Without Software
Manual pricing feels free because no invoice shows up for it. It isn't free, it's just invisible: the cost shows up as sales you lost to a price set too high, margin you gave away at a price set too low, and hours spent re-checking numbers by hand instead of running the business. Here's how to put a real figure on that cost, how to calculate whether pricing software actually pays for itself, and how to make that case to whoever signs off on the budget.
Where Manual Pricing Actually Loses Money
Manual pricing doesn't fail loudly. It fails as a slow, distributed leak across three channels: prices set too high, prices set too low, and the time spent maintaining a system that can't scale past a spreadsheet. None of these show up as a line item, which is exactly why they're easy to underestimate.
Overpriced products lose sales you never see
A product priced above what the market will bear doesn't generate a refund or a complaint, it just quietly converts worse than it should. Without a way to measure how demand responds to price, there's no signal that tells you a product is overpriced, only a general sense that "sales feel a little slow," which is too vague to act on. The lost sales never appear as a number anywhere in your reporting, they just don't happen.
Underpriced products leave margin no one notices
The opposite failure is quieter still, because underpricing looks like success. Units move, revenue comes in, nothing looks broken. The gap between what you charged and what customers would actually have paid never appears on a dashboard, since there's no line item for "profit not collected." A store can run steadily underpriced for years without anyone flagging it, because nothing about steady, moderate underpricing looks like a problem from the outside.
The time cost of checking prices by hand
Even setting aside mispriced products entirely, manual pricing has a direct time cost. A 2026 survey of 1,003 US operations professionals by workflow software company DOSS found that professionals spend an average of 3.6 hours a week fixing spreadsheet-driven errors, more than 22 full workdays a year per employee, and that a single significant spreadsheet error costs an organization an average of $4,315 (DOSS, "Spreadsheet Error Costs," 2026). Pricing spreadsheets aren't exempt from that pattern, they're a manual, repeatedly-touched dataset with exactly the error profile the survey describes.
What One Manual Pricing Mistake Really Costs
It's worth grounding this in a real, documented case rather than a hypothetical, even though the closest verifiable example I could find isn't from ecommerce specifically. In June 2003, Canadian power producer TransAlta Corp made a copy-paste error in a spreadsheet used to bid on US power transmission hedging contracts. The mistake caused the company to buy far more contracts, at worse prices, than intended, a single formatting slip that cost the company roughly $24 million and about 10% of that quarter's profit.
I looked specifically for a more recent, ecommerce-specific version of this story, a DTC brand or online retailer with a named, dated, verifiable pricing mistake in the last year, and didn't find one solid enough to use. Vendor blog posts cite figures like "$180,000 a year" or "€4,200 a month" in pricing losses, but none of them attribute those numbers to a named company or a checkable source, so they're left out here rather than repeated as fact. TransAlta is 23 years old and outside ecommerce, but it's real, named, dated, and independently documented, which is a higher bar than most of what circulates about pricing mistakes online. The mechanism it illustrates, a single manual error compounding across enough transactions to become a material loss, applies just as directly to a spreadsheet of SKU prices as it does to a spreadsheet of energy contracts.
How to Calculate the ROI of Pricing Software Before You Buy It
The most credible ROI estimate doesn't come from a vendor's marketing page, it comes from your own numbers run through a simple formula: ROI = (value recovered − subscription cost) / subscription cost. The hard part isn't the formula, it's getting an honest number for "value recovered" without a source you can defend.
A useful anchor for that number comes from McKinsey's well-known Global 1200 pricing research: for the average large company, a 1% price increase, if sales volume holds steady, converts to roughly an 11% increase in operating profit, since the extra revenue drops almost straight to the bottom line with no matching increase in cost of goods (Michael Marn and Robert Rosiello, McKinsey & Company, first published in Harvard Business Review, 1992, and widely re-cited since). The "if volume holds steady" condition is the important part, it's not a promise every SKU can absorb a 1% increase, it's a reference point for how much leverage a correctly-targeted pricing change has when the data says a product actually can.
Worked example: take a store doing $20,000 a month in profit, pricing manually, with no systematic way to tell which SKUs can safely absorb a change. One correctly-targeted 1% correction, on a product where the elasticity data supports it, is worth roughly 11% of that $20,000 base: about $2,200 in additional monthly profit, or $26,400 a year, from a single price change. Weighed against a $99/month Growth-tier subscription ($1,188/year), the breakeven point isn't close, the harder question is how many correctly-targeted changes a catalog actually has sitting in it, which is exactly what an elasticity model is built to find.
| Monthly store profit | Value of one 1% correction (McKinsey's ~11% figure) | Annualized value | Zorin Growth plan ($99/mo) |
|---|---|---|---|
| $5,000 | $550 | $6,600 | $1,188/yr |
| $10,000 | $1,100 | $13,200 | $1,188/yr |
| $20,000 | $2,200 | $26,400 | $1,188/yr |
| $50,000 | $5,500 | $66,000 | $1,188/yr |
This table assumes just one correctly-targeted 1% change a year, a deliberately conservative floor, not a projection of what a full-catalog elasticity read typically finds. For a more precise breakeven number tailored to your own plan tier and profit base, a simple breakeven calculation walks through the exact math.
See what Zorin's elasticity model says about your own catalog.
Start free trialWhat a Realistic Payback Period Looks Like
Given the numbers above, the honest answer is that pricing software with a real elasticity model typically pays for itself within the first month, not the first year, as long as the store has enough sales history for the model to say something specific. That's a different claim than "any pricing tool pays for itself instantly," since a tool with no real signal behind its recommendations isn't generating the value in the first place, it's just adding a subscription cost on top of the same guesswork. The payback period is a function of the recommendation's quality, not the existence of software.
A useful gut check before committing: if a store doesn't yet have enough sales history or price variation for a model to produce a confident recommendation, the payback period estimate above doesn't apply yet, since there's nothing for the model to correctly target. How much sales history you actually need covers that threshold in detail before you run the ROI math on your own store.
How to Make the Case to Whoever Signs Off on Budget
If you're not the only person who needs to approve a new subscription, a three-step version of this argument tends to land better than a general pitch about "better pricing."
Step 1: Name the specific leak, not a general problem
"We're pricing manually and it's inefficient" is easy to dismiss. "We haven't repriced 40% of our catalog in over six months, and we have no way to tell which of those products is underpriced" is a specific, checkable claim that's harder to wave away.
Step 2: Bring the breakeven number, not a vendor's ROI percentage
Use your store's own monthly profit and the table above (or the full breakeven calculation) to show the smallest realistic value the tool needs to generate before it pays for itself. A specific, conservative number defended with your own data is more persuasive than any vendor's headline ROI claim, and it survives a skeptical follow-up question.
Step 3: Propose a bounded trial, not a full-catalog commitment
Whoever controls the budget is usually more willing to approve a small, reversible test than an open-ended commitment. Proposing a trial against a subset of SKUs, with a specific number you'll report back (profit lift, confidence scores, or both), turns the ask from "trust me" into "let's check in 30 days."
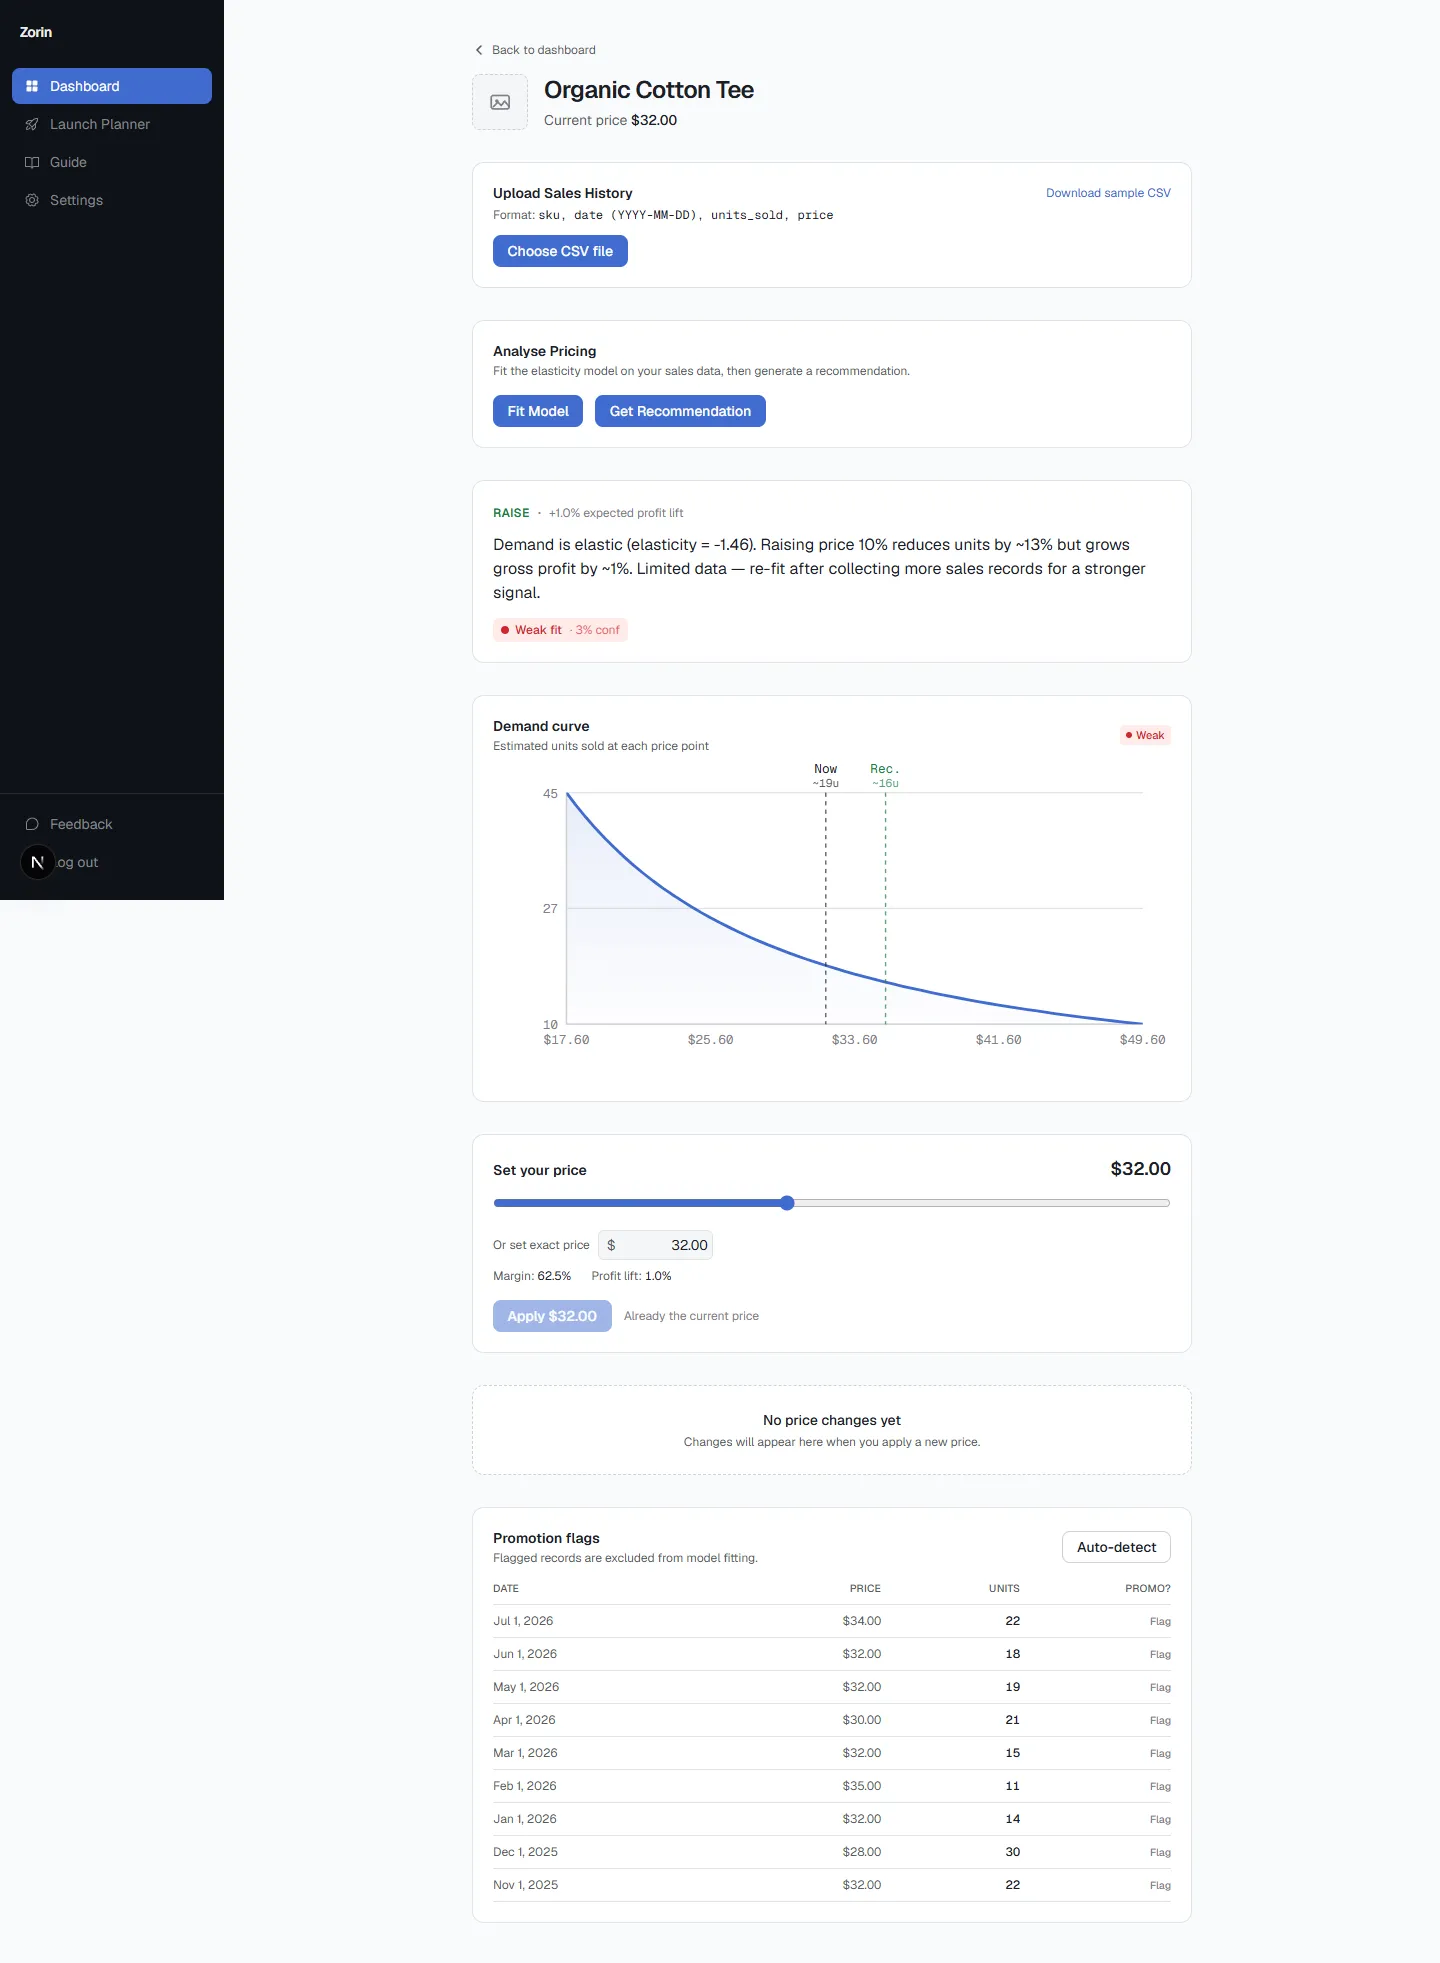
This is the specific gap Zorin is built to close. It connects to a Shopify or WooCommerce store, or a CSV of sales history, fits a price elasticity model per SKU, and returns a raise, lower, or hold recommendation with an estimated profit lift and a confidence score based on how much real data actually supports it. Nothing changes automatically, every recommendation is reviewed and applied by the merchant, which is what makes it possible to run the bounded trial described above: apply the strong-confidence recommendations on a handful of SKUs, measure the result, and decide from there.
Key Takeaways
- Manual pricing's cost hides in three places: overpriced products losing sales you can't see, underpriced products leaving margin no one notices, and the direct time cost of maintaining prices by hand.
- A 2026 DOSS survey of 1,003 operations professionals found 3.6 hours a week lost to spreadsheet errors and a $4,315 average cost per significant incident, a pattern that applies directly to pricing spreadsheets.
- TransAlta's 2003 spreadsheet copy-paste error, which cost roughly $24 million, is the most verifiable documented example of a single manual pricing mistake's real cost, even though it's not from ecommerce specifically.
- Using McKinsey's finding that a 1% price increase converts to roughly 11% more operating profit when volume holds, even one correctly-targeted 1% fix a year clears most pricing software subscriptions by a wide margin.
- The strongest pitch to whoever controls budget names a specific leak, brings a conservative breakeven number calculated from your own data, and proposes a bounded trial instead of a full commitment.
Frequently Asked Questions
How do I calculate the ROI of pricing software before I commit to it?
Use ROI = (value recovered - subscription cost) / subscription cost. Estimate value recovered conservatively, using a reference point like McKinsey's finding that a 1% price increase converts to roughly 11% more operating profit when volume holds, applied to a single correctly-targeted SKU change against your own monthly profit.
What's a realistic payback period for pricing optimization software?
Software backed by a real elasticity model typically pays for itself within the first month, as long as the store already has enough sales history and price variation for the model to produce a confident recommendation. Without that data, the payback estimate doesn't apply yet.
How much revenue am I actually losing by pricing products manually?
It's rarely visible directly, since overpriced products just convert worse and underpriced products look like normal sales. A 2026 industry survey found operations teams lose 3.6 hours a week and $4,315 per significant error to spreadsheet-driven mistakes alone, before counting any single mispriced SKU.
How do I make the case for a new pricing tool to a co-founder or accountant who controls the budget?
Name a specific, checkable leak rather than a general problem, bring a conservative breakeven number calculated from your own store's profit rather than a vendor's ROI percentage, and propose a small, bounded trial with a defined check-in point instead of asking for a full commitment upfront.
What numbers should go into an ROI pitch for pricing software?
Three numbers: the subscription cost, your store's current monthly profit, and a conservative estimate of value recovered from even one correctly-targeted price change, using a defensible reference point rather than a vendor's own marketing claim.
Is a spreadsheet pricing error really expensive for a small store?
Yes, proportionally. A 2026 DOSS survey put the average cost of a single significant spreadsheet error at $4,315 across organizations of all sizes, and TransAlta's well-documented 2003 copy-paste error cost roughly $24 million at enterprise scale, showing the same mechanism compounds at every size.
Does pricing software replace the need to review prices myself?
No. A well-built tool like Zorin returns a recommendation with a confidence score, but the merchant reviews and applies each change, nothing updates automatically. The software's role is surfacing which SKUs are worth a look and how confident the data is, not removing the merchant from the decision.
Once you have a rough sense of what manual pricing might already be costing you, a simple breakeven calculation turns that into a specific number for your own plan tier, and what to look for in a pricing app covers how to shortlist a vendor once the budget case is made. Zorin's free margin calculator is a fast way to sanity-check the per-product numbers behind any pitch before you bring them to whoever signs the check.
Manual pricing isn't free, it just doesn't send an invoice. The cost shows up as sales lost to prices set too high, margin given away at prices set too low, and hours spent maintaining a system that was never built to scale past a spreadsheet. Once that cost has a real number attached to it, the ROI question mostly answers itself.
Written by Dexter
Dexter is part of the team at Zorin, building tools that help ecommerce merchants price with data instead of guesswork.