How Much Sales History for Elasticity Pricing?
Most guides to price elasticity modeling cite an enterprise number: a minimum of two years of pricing and sales history before the calculation is worth trusting. For an independent Shopify or WooCommerce store, that number is discouraging and mostly wrong. The practical floor sits much lower, closer to 3 to 6 months, and it depends less on how long your store has existed than on whether your price has actually moved during that window.
The Real Data Threshold (Not the One Most Guides Cite)
The two-year figure comes from enterprise retail research, built around chains managing tens of thousands of SKUs with dedicated pricing teams and years of stable point-of-sale history. It's a real number for that context, and a misleading one for a 40-SKU Shopify store six months into its first year.
A more practical floor, closer to what an independent merchant can actually hit, looks like three things together: 3 to 6 months of daily or weekly sales data, at least 10 to 15% price variation somewhere in that window (meaning the price actually moved, not just sat flat), and roughly 30 to 50 distinct price-and-quantity observations to fit against. Hit all three and a model has something real to read. Miss the middle one, price variation, and even years of sales history won't help, because a flat price line has no elasticity signal in it at all.
Volume Isn't the Same as Signal
This is the distinction most generic forecasting advice blurs. A product that's sold steadily at one price for 18 months has plenty of sales volume and almost no elasticity signal, because the model needs to see what happened when price moved, not just how many units sold at a single number. A product that's only existed for 4 months but had one real price change, a launch discount ending, a cost-driven increase, can carry more usable signal than the 18-month flat-price product does.
Worked example: say a product sold 40 units a month for 5 months at $28, then the price moved to $32 for the 6th month and sold 33 units. That's only 6 months of history, but it's one real price-and-quantity data point on top of a stable baseline, roughly a (33-40)/40 = -17.5% change in quantity against a (32-28)/28 = 14.3% change in price, giving an approximate elasticity of -1.22. A second product with 18 months of flat $28 pricing and zero price changes gives a model nothing to calculate at all, regardless of how many units it's sold.
What Happens Before You Hit the Threshold
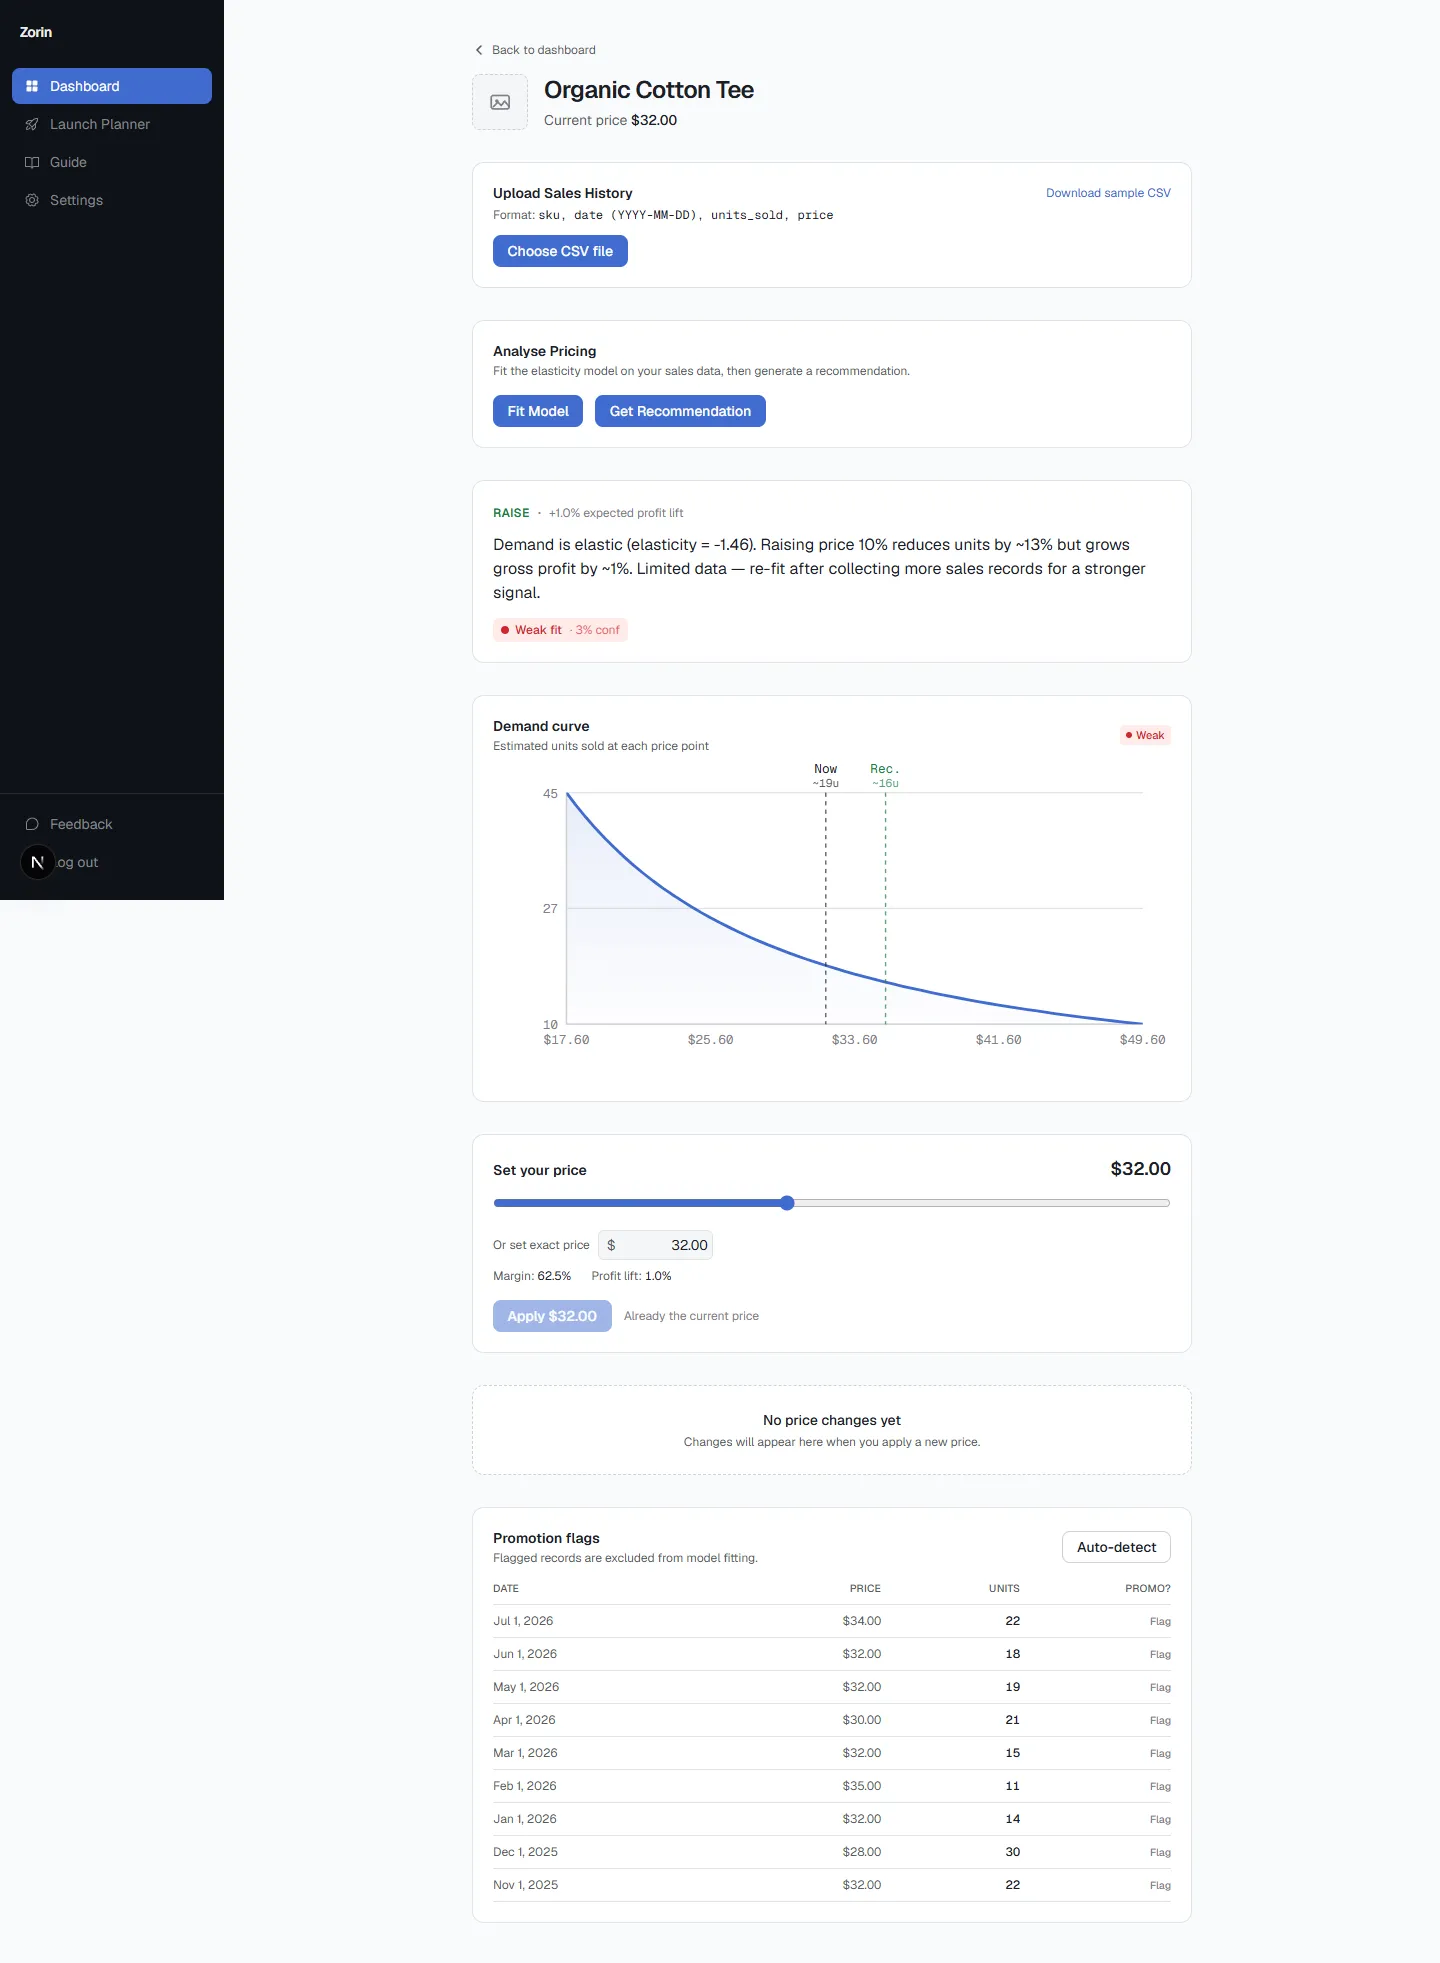
Below the practical floor, a well-built tool shouldn't refuse to return anything, it should return a number with an honest confidence label attached. A raise, lower, or hold recommendation is still useful directionally even from thin data, as long as the merchant knows it's thin. What's actually dangerous is a tool that presents a two-week-old product's recommendation with the same confident tone as a two-year-old bestseller's, because that's the version that costs real money when a merchant trusts a number that never earned the trust.
See what Zorin's elasticity model says about your own catalog.
Start free trialHow Confidence Scoring Replaces a Fixed Minimum
Zorin fits a price elasticity model per SKU directly from a store's own Shopify or WooCommerce order history, or a CSV upload, and attaches a confidence label, commonly Strong, Fair, or Weak, based on how much real data and price variation actually back the estimate. A thin-data product isn't blocked from getting a recommendation, it's just labeled honestly instead of dressed up with false certainty. That's a meaningfully different approach from a tool that either refuses to run below a hard cutoff or, worse, returns every recommendation with identical confidence regardless of what's actually behind it.
The label matters practically: a Strong recommendation is reasonable to apply directly, a Weak one is worth treating as a starting hypothesis to sanity-check against your own judgment before committing, not a number to bulk-apply across your catalog without a second look.
Is Your Catalog Too Small, or Just Too New?
These are two different questions merchants tend to conflate. Catalog size, how many SKUs you carry, mostly determines how much manual work a rule-based approach would take, not whether elasticity modeling works at all. A 15-SKU store with 8 months of history and a couple of real price changes is in better shape than a 300-SKU store where every product has sat at the same price since launch. Newness, not smallness, is the real constraint. A brand-new store with zero price history hasn't given any model, from any vendor, anything to calculate yet, regardless of catalog size.
No Price History Yet? Here's the Other Signal
For a genuinely new product with no sales history at all, elasticity modeling has nothing to read yet, and no tool can responsibly manufacture a number from data that doesn't exist. Zorin's answer for that specific gap is a separate Van Westendorp price sensitivity survey: a merchant generates a shareable, no-login link, customers answer four classic price-perception questions, and the tool calculates an acceptable price range and optimal price point once enough responses accumulate, with its own honest confidence tier based on response count. It's a stated-preference signal, what customers say they'd pay, kept deliberately separate from the elasticity model's revealed-preference read, useful specifically in the window before there's enough sales history for the elasticity side to say anything at all.
Key Takeaways
- The commonly cited "two years of history" threshold comes from enterprise retail research. A more practical floor for an independent store is 3 to 6 months, with real price variation and roughly 30-50 price-quantity observations.
- Sales volume alone isn't elasticity signal. A model needs to see what happened when price actually moved, so a flat-priced product with 18 months of history can carry less usable signal than a 6-month product with one real price change.
- Below the practical threshold, the right behavior is an honestly-labeled thin-data recommendation, not a refusal and not false confidence.
- Catalog size and catalog age are different constraints. A small, older catalog with real price movement is in better shape than a large, newer one where every price has sat flat.
- For a genuinely new product with zero sales history, a Van Westendorp survey is a usable second signal while elasticity data accumulates.
Frequently Asked Questions
How much sales history do I need before a pricing tool's elasticity model actually works?
A practical floor is 3 to 6 months of sales data with at least 10-15% price variation somewhere in that window and roughly 30-50 distinct price-and-quantity observations. The commonly cited "two years" figure comes from enterprise retail research and overstates what an independent store actually needs.
Is my catalog too small for elasticity-based pricing software?
Catalog size mostly affects how much manual work a rule-based approach takes, not whether elasticity modeling works. Catalog age and price-history depth matter more than SKU count, a small catalog with real price movement is in better shape than a large one where every price has sat flat.
What happens if I don't have enough sales data yet for accurate elasticity modeling?
A well-built tool should still return a recommendation, just with an honest confidence label reflecting how much real data supports it, rather than either refusing to run or presenting a thin-data guess with the same certainty as a well-established product.
Do I need price variation in my sales history, or just enough sales volume?
Price variation matters more. A product that's sold steadily at one unchanged price for a year and a half gives a model nothing to calculate, since elasticity measures how quantity responds to a price change, and there's no change to measure.
How is a confidence score different from just having enough data?
A confidence score is the tool's own honest read on how much its recommendation should be trusted, based on both data volume and price variation, rather than a binary pass/fail gate. It lets a thin-data product still get a directional recommendation, labeled clearly as less certain, instead of either blocking it entirely or dressing it up with false confidence.
What should I do if my product has no sales history at all?
Elasticity modeling has nothing to read from zero sales history, so a Van Westendorp price sensitivity survey is the more useful signal in that window, a four-question customer survey that produces an acceptable price range based on what customers say they'd pay rather than what they've already done.
For the full worked calculation behind a Van Westendorp price range, Van Westendorp Calculation: A Worked Example walks through it step by step, and if you're weighing whether your store has outgrown manual pricing rules entirely, is your store ready for dynamic pricing software covers the broader readiness signals. Curious what confidence tier your own catalog would get? Connect your store and see your first recommendation.
The data bar for elasticity pricing is lower than most guides make it sound, and it's about price movement more than time in business. Six months with one real price change beats two years of a number that never budged, and a tool that labels its own confidence honestly is more useful at every stage than one that pretends every recommendation is equally certain.
Written by Dexter
Dexter is part of the team at Zorin, building tools that help ecommerce merchants price with data instead of guesswork.