How to Run a Van Westendorp Price Survey
If you're launching a new product and have no sales history to work from, setting a price can feel like a guess dressed up as a decision. Cost-plus math gives you a floor, and a competitor's price gives you a reference point, but neither tells you what your own customers would actually be willing to pay. A method called the Van Westendorp Price Sensitivity Meter solves exactly this problem. It asks real customers four simple questions about price and turns their answers into a defensible range, even when you have zero sales data to fall back on. Zorin runs this survey natively for any product in your catalog, no separate tool or export required. This guide covers how the method works, how many responses you actually need, who to send it to, and how to read the results once they come in.
What a Price Sensitivity Survey Actually Measures
The Van Westendorp Price Sensitivity Meter was developed by Dutch economist Peter van Westendorp in 1976. It asks each respondent four open-ended pricing questions about the same product:
- At what price would this product be so cheap that you'd question its quality?
- At what price would this product be a bargain, a great value for the money?
- At what price would this product start to feel expensive, but you'd still consider buying it?
- At what price would this product be too expensive to consider buying at all?
Plotting the answers across enough respondents produces four curves that intersect to define an acceptable price range, an optimal price point, and an indifference price point, the price at which roughly equal numbers of people see the product as a bargain and as getting expensive.
A related method, Gabor-Granger, is worth knowing about even though Zorin doesn't run it. Instead of asking open-ended price questions, Gabor-Granger shows respondents a specific price and asks a direct yes-or-no purchase intent question, then adjusts the price up or down based on the answer. It's better suited to an established product where you already have a reasonable price range in mind and want to validate a specific number. Van Westendorp is the better fit when the price is genuinely unknown, which is exactly the situation a new product launch puts you in.
Stated Preference vs Revealed Preference
A survey measures stated preference: what customers say they'd pay when asked directly. Price elasticity, by contrast, measures revealed preference: what customers actually did when your price changed in the real world. These are different signals, and it's worth knowing they don't always agree. When they disagree, survey answers usually run high: a 2020 meta-analysis by Schmidt and Bijmolt covering 77 studies found hypothetical willingness to pay was 21% above real willingness to pay on average. People say they'd pay more than they do once real money is involved. That gap doesn't make the survey useless. It means the survey result is a starting point and a sanity check, not a number to treat as gospel on its own.
Running the Survey With a Built-In Tool
Zorin includes the Van Westendorp survey as a built-in feature, not a separate integration or a third-party tool you need to configure. From any product in your catalog, you generate a shareable survey link. The link requires no customer login or account to answer, and no email, name, or IP address is stored with a response.
The four questions are asked in Zorin's interface exactly as the method specifies: too cheap to trust the quality, a bargain, starting to feel expensive, and too expensive to buy. You send the link to actual customers or prospects for that specific product, through email, a post-purchase message, a social post, or wherever you'd normally reach your audience.
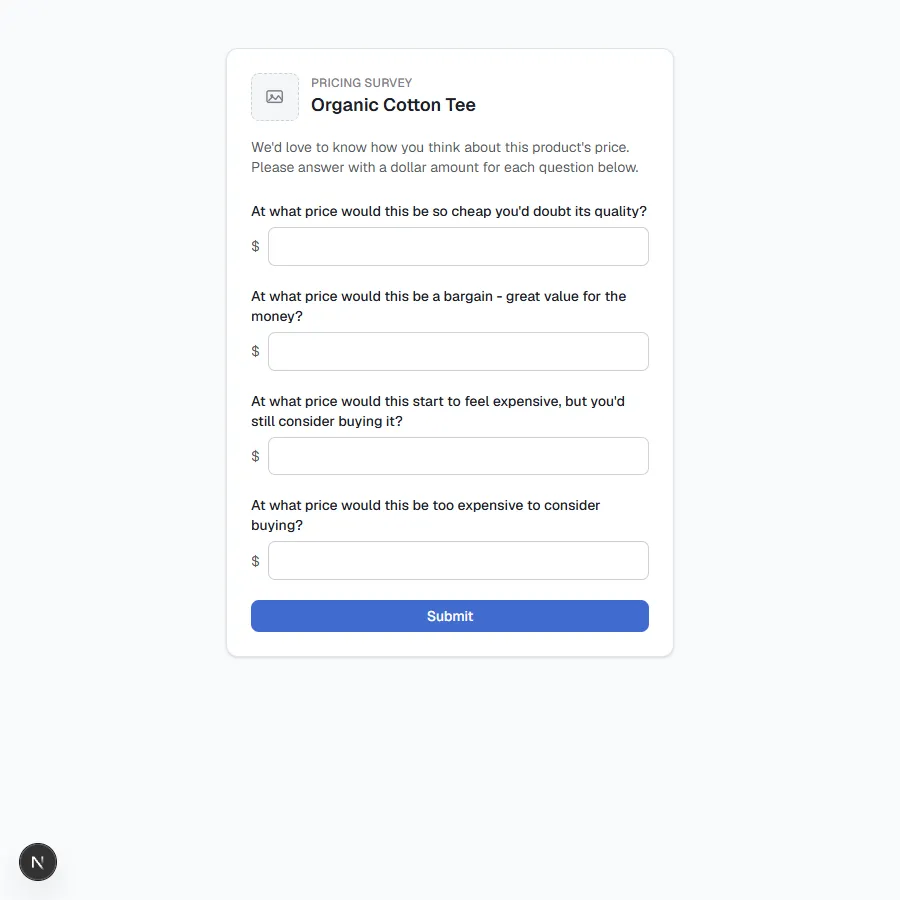
Because it's built into the same platform where your elasticity data already lives, you don't need to export survey results into a separate spreadsheet and cross-reference them manually against your sales history. Both signals sit side by side on the same product. Prefer to run this yourself first, or don't have a Zorin account yet? Grab the exact four-question wording from the free Van Westendorp survey template and send it however you'd like.
How Many Responses You Need
Response volume determines how much you can trust the result, and Zorin surfaces this directly rather than showing you a range that looks precise before it actually is.
| Responses | Confidence Tier | What It Means |
|---|---|---|
| Under 5 | No tier shown | Not enough data yet to plot a meaningful curve |
| 5 to 19 | Low confidence | Directional range, useful for a first read |
| 20 or more | Good confidence | Reliable enough to inform an actual pricing decision |
For context, broader market research practice for a directional read typically targets 100-200 respondents, and 300 or more for a high-confidence business decision at scale. Those numbers come from research designed to represent an entire market. Zorin's thresholds are calibrated for a single SKU rather than a market-wide study, which is why the useful range starts meaningfully lower. You're not trying to model an entire market, just get a read on how this specific product's price is perceived by the people most likely to buy it.
Where to Source Respondents
The survey is only as useful as the people answering it. A generic, disconnected audience with no real interest in the product tends to produce a wide, unhelpful range, because respondents are guessing at a hypothetical rather than reasoning from real purchase intent. A few sources tend to produce more reliable responses:
- Existing customers of related products. People who've already bought from your store have context for your brand and pricing tier that a stranger doesn't.
- Email subscribers who haven't purchased yet. They have interest without the anchor of already knowing your current price for this exact product.
- Post-purchase follow-up for a related or upcoming product. A customer who just bought something adjacent is a reasonable proxy for the audience of a new or related launch.
Avoid recruiting responses from a general audience with no connection to your brand or category. The Van Westendorp method depends on respondents having genuine purchase intent for a product like this one, not a hypothetical opinion from someone who would never buy it regardless of price.
Reading Your Results
Once you hit the 20-response threshold, Zorin calculates three numbers from the response curves.
The acceptable price range. The band between where "too cheap" and "too expensive" perceptions cross the "bargain" and "getting expensive" perceptions. Pricing outside this range in either direction risks losing the sale, either from a quality doubt at the low end or a hard no at the high end.
The optimal price point. The point where the "too cheap" and "too expensive" curves intersect. This is often read as the price with the lowest resistance across the sample, not necessarily the price that maximizes revenue.
The indifference price point. The point where "a bargain" and "getting expensive" curves intersect. Roughly equal numbers of respondents see the price as a good deal versus starting to feel steep at this point.
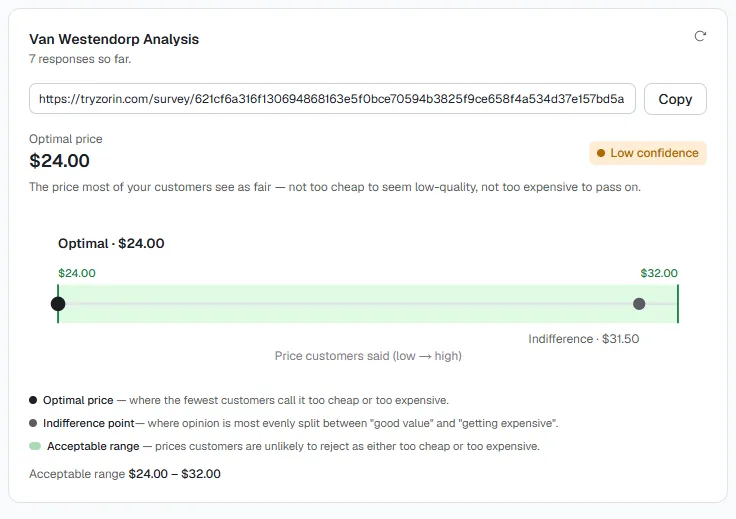
These three numbers together give you a defensible starting price, particularly useful for a product with no sales history yet, and a range to reference when a price change is under consideration for an existing product.
See what Zorin's elasticity model says about your own catalog.
Start free trialWhy This Runs Alongside Elasticity, Not Blended Into It
Zorin deliberately keeps the price sensitivity survey as a separate advisory panel rather than folding its output into the raise, lower, or hold elasticity recommendation. Stated preference and revealed preference are different signals, and collapsing them into one number would hide a genuine discrepancy that's often worth noticing.
If your elasticity model says a product can absorb a price increase based on actual purchase behavior, and your survey respondents also indicate room above your current price, that's two independent signals agreeing. If they disagree, that's worth investigating rather than averaging away. A gap between what people say they'd pay and what your sales data shows they actually pay can point to something specific: maybe your checkout experience is losing price-sensitive buyers before they complete a purchase, or maybe your survey respondents don't represent your actual buyer base as closely as you assumed.
Reading both side by side, rather than as a single blended figure, is what lets you catch that kind of discrepancy instead of averaging it into invisibility. For a shorter walkthrough of the four questions and what a completed survey card looks like, see what price your customers are willing to pay.
When to Use a Survey Instead of Waiting for Elasticity Data
A price elasticity model needs real sales history with genuine price variation to produce a reliable estimate, typically at least 6 months of data. A price sensitivity survey doesn't have that requirement. It works from day one, before a product has sold a single unit.
That makes it the right tool specifically for new product launches, where you have no revealed-preference data to model from and need a defensible starting price rather than a guess anchored only to cost-plus math or a competitor's number. It's also useful for validating a planned price change on an existing product before committing, particularly when the change is large enough that waiting for post-change sales data to confirm it went well feels too risky to attempt blind.
Run your own Van Westendorp survey from any product in your Zorin catalog. Start a free trial to generate a shareable link and see results update as responses come in.
What the Research Says About Survey-Based Pricing
Van Westendorp is one of several ways to measure willingness to pay; a widely cited review by Breidert, Hahsler and Reutterer compares it with other survey and market-based methods. The main caution is that stated answers run high: a 2020 meta-analysis by Schmidt and Bijmolt covering 77 studies found hypothetical willingness to pay was 21% above real willingness to pay on average. Treat the range a survey gives you as an upper guide, and let real sales data take over once you have it.
Key Takeaways
- The Van Westendorp method asks four questions covering too cheap, a bargain, getting expensive, and too expensive, and plots the answers into an acceptable range and two price points.
- It's the right tool when you have no sales history, since it measures stated preference from real customers rather than requiring past purchase data to model from.
- Zorin runs this survey natively per product, with a shareable, no-login link and no personal data stored with responses.
- Confidence scales with response volume: no tier under 5 responses, low confidence at 5-19, good confidence at 20 or more.
- Survey data and elasticity data stay separate on purpose. Reading stated preference and revealed preference side by side lets you catch a disagreement between them instead of averaging it away.
Frequently Asked Questions
How do I run a price sensitivity survey for my Shopify or WooCommerce store?
If you're using Zorin, generate a shareable survey link directly from any product in your catalog. The link asks the four standard Van Westendorp questions and requires no customer login. Send it to existing customers, email subscribers, or post-purchase audiences with genuine interest in that product category.
How many responses do I need for a reliable result?
At least 20 responses for what Zorin labels good confidence. Between 5 and 19 responses gives a directional read labeled low confidence, useful as an early signal but not a number to commit a final price to. Under 5 responses, no confidence tier is shown because there isn't enough data yet.
What are the four Van Westendorp questions?
At what price is this product so cheap you'd question its quality? At what price is it a bargain? At what price does it start to feel expensive, but you'd still consider it? At what price is it too expensive to consider buying? Each respondent answers all four for the same product.
What's the difference between a price sensitivity survey and price elasticity?
A survey measures stated preference, what customers say they'd pay, and works even for products with no sales history. Elasticity measures revealed preference, what customers actually did when the price changed historically, and requires real sales data with price variation, typically at least 6 months worth. Both are useful and Zorin keeps them as separate signals rather than blending them into one number.
Can I use a price sensitivity survey for a brand-new product with no sales history?
Yes, this is one of the strongest use cases. A Van Westendorp survey doesn't require any past sales data, since it asks customers directly about price perception. It's a useful input for setting a defensible launch price before an elasticity model has enough history to run.
What's the difference between Van Westendorp and Gabor-Granger?
Van Westendorp asks open-ended questions to find a price range when the right price is genuinely unknown, which is why it fits new product launches well. Gabor-Granger shows respondents specific prices and asks a direct yes-or-no purchase question, which works better for validating a number on an established product where you already have a reasonable range in mind. Zorin runs Van Westendorp.
Does Zorin store any personal information from survey respondents?
No. The survey link requires no login or account, and no email, name, or IP address is stored with a response.
What do I do if my survey results and my elasticity data disagree?
Investigate rather than average the two together. A disagreement can point to something specific worth checking, such as your survey respondents not closely matching your actual buyer base, or a gap between what people say and what happens at your actual checkout. Zorin keeps the two signals separate specifically so a discrepancy like this stays visible instead of getting smoothed over.
How is the optimal price point different from the acceptable price range?
The acceptable price range is the band between where quality doubt and price rejection start to dominate, essentially the safe zone. The optimal price point is a single number inside that range, where resistance to the price is lowest across your respondents. The range tells you the boundaries; the optimal point tells you where within those boundaries perceived resistance is smallest.
Whether you're setting a launch price with no sales history to lean on, or sanity-checking a planned increase before you commit to it, hearing directly from the people who'd actually buy the product is a signal worth having next to your own sales data, not instead of it. Zorin runs the survey and the elasticity model on the same platform, so both numbers are there when you're ready to decide. A survey is one way to reduce that uncertainty before you commit to a price; how it compares to actually testing a live price with real customers is worth reading before you decide which one to run first.
Written by Dexter
Dexter is part of the team at Zorin, building tools that help ecommerce merchants price with data instead of guesswork.
More in Price Sensitivity Surveys
View all →Do You Need a Survey If You Have Sales Data?
A pricing survey and your sales history measure different things. See when a Van Westendorp survey beats elasticity data, and when it doesn't.
How to Interpret Van Westendorp (PSM) Results
Learn what the four Van Westendorp price points actually mean, how to read a narrow vs wide range, and why the optimal price point isn't your final price.
Price Survey vs Price Testing: Which to Trust?
How stated vs revealed preference differ, the real risks of live price testing, and how to combine a survey with a test for a reliable price.