Price Elasticity Explained: A Guide for Ecommerce Sellers
Price elasticity measures how much your sales volume shifts when you change a price. If a small price increase barely dents your sales, your demand is inelastic and you likely have room to raise prices without losing much. If a small increase sends customers straight to a competitor, your demand is elastic, and pricing power is limited.
Key Takeaways
- Elasticity equals the percentage change in quantity demanded divided by the percentage change in price, a simple before-and-after comparison is often all you need to calculate it.
- A result between 0 and -1 means inelastic demand (customers keep buying through a price change); beyond -1 means elastic demand (they respond strongly).
- Elasticity is driven mainly by substitute availability, necessity, price transparency, and brand loyalty, not randomness.
- There's no universal "good" score, compare against your own category, and treat a result beyond roughly 3.5 in absolute value as a likely data issue rather than real behavior.
- Zorin calculates this exact coefficient automatically per product from your own sales history, with an R-squared fit and a confidence label, so you don't have to run the formula by hand for every SKU.
I didn't think about elasticity much until I raised a product's price by 8% expecting a modest sales dip, and watched volume barely move. That gap between what I expected and what actually happened is exactly what this concept explains. Once you understand it, a lot of pricing decisions that used to feel like guesswork start to feel like math. This is exactly the number Zorin calculates automatically: it fits an elasticity model per product from your own sales history and returns a raise, lower, or hold recommendation, so you don't have to run this math by hand for every SKU, but understanding what the number actually means is what makes a specific recommendation easier to trust.
What Price Elasticity Actually Measures
Price elasticity quantifies the relationship between a price change and the resulting change in how much customers buy. It's the single number that underlies every other question in this guide, whether a product is elastic, what a "good" score looks like, or how to calculate one from your own sales data.
The formula is straightforward: price elasticity of demand equals the percentage change in quantity demanded divided by the percentage change in price. If you raise a price by 10% and sales drop by 5%, your elasticity is -0.5. That negative sign shows up because price and quantity typically move in opposite directions, and it's expected, not a sign something's wrong with your math.
Once you have that single number, you can read it two ways. A result between 0 and -1 means demand is inelastic: customers keep buying even as price moves. A result beyond -1 means demand is elastic: customers respond strongly to the same price change. That distinction is worth sitting with for a second, because it changes what a smart pricing move looks like for that specific product.
The takeaway: price elasticity is percentage change in quantity divided by percentage change in price, and it's the foundation every other elasticity question in this guide builds on.
Elastic vs. Inelastic Demand: What's the Difference
Elastic demand means a small price change causes a large shift in how much customers buy. Inelastic demand means the opposite: price can move noticeably and sales barely react. Knowing which one you're dealing with changes whether a price increase is a smart move or a risky one.
There's actually a third case worth knowing, called unitary elasticity, where the percentage change in demand matches the percentage change in price exactly, leaving total revenue roughly unchanged. Here's how the three break down in practice:
| Type | What happens | Common examples |
|---|---|---|
| Elastic demand (elasticity greater than 1) | A price increase causes a proportionally larger drop in sales | Products with many close substitutes, generic phone cases, a soda brand next to a competing brand on the shelf |
| Inelastic demand (elasticity less than 1) | Sales barely move even with a real price change | Essentials or products with few real alternatives, gasoline being the textbook example |
| Unitary elasticity (elasticity equal to 1) | Demand shifts in exact proportion to price; revenue stays roughly flat | Rare in practice, mostly a theoretical reference point |
The most useful mental shortcut here: elastic products compete on price and volume, inelastic products compete on value and margin. Knowing which side your product sits on tells you which lever is actually worth pulling.
The takeaway: elastic demand reacts strongly to price changes, inelastic demand barely reacts, and that single distinction should guide whether you compete on price or protect margin.
How Is Price Elasticity Actually Calculated
The calculation only needs two data points on either side of a price change: your quantity sold before and after, and the price before and after. It's simple enough to run in a spreadsheet without any statistics background.
Here's a worked example using round numbers. Say you're selling 80 units a day at $6. You lower the price to $4, and daily sales rise to 100 units.
Step 1: Calculate the percentage change in quantity. (100 minus 80) divided by 80, which comes out to 25%.
Step 2: Calculate the percentage change in price. ($4 minus $6) divided by $6, which comes out to negative 33%.
Step 3: Divide the two. 25% divided by negative 33% gives an elasticity of roughly -0.76.
That result sits between 0 and -1, so this product is showing inelastic demand. The price cut generated some extra volume, but not enough to suggest the product is highly price sensitive. If you'd expected the lower price to double your sales and it only lifted them by 25%, this calculation tells you exactly why, and whether the discount was worth the margin you gave up.
For larger price swings, a refined version called arc elasticity is sometimes used to avoid the calculation depending on which price point you treat as the "starting" one, but the basic percentage-change formula above is the one worth knowing first. Zorin runs a more rigorous version of this same idea automatically, a log-log regression across your full price-and-quantity history rather than a single before-and-after snapshot, which is what the underlying model actually calculates for every product with enough sales history.
The takeaway: elasticity equals percentage change in quantity divided by percentage change in price, and a simple before-and-after comparison is often all you need to run it.
What's a Good Price Elasticity Score for My Products
There's no single "good" elasticity score. What matters is how your number compares to your own category, and whether it lines up with your pricing goal, protecting margin or driving volume.
That said, industry benchmarks give you something concrete to compare against rather than guessing in a vacuum:
| Category | Typical elasticity | Reading |
|---|---|---|
| Grocery staples | -0.5 to -0.8 | Solidly inelastic |
| Standard consumer electronics | Often beyond -1.3, sometimes higher | Clearly elastic, reflecting heavy comparison shopping |
| Premium or luxury brands | Often -0.6 to -0.8 | More inelastic than their category average, since brand loyalty softens price sensitivity |
One sanity check worth knowing: if your calculated elasticity comes out above roughly 3.5 in absolute value, that's usually a sign of a data quality issue rather than genuinely extreme consumer behavior. Before you act on a wild number, double check that you're not comparing mismatched time periods or conflating a promotional price with your base price. This is exactly why flagging and excluding promotional spikes from your baseline sales history matters before trusting an elasticity read.
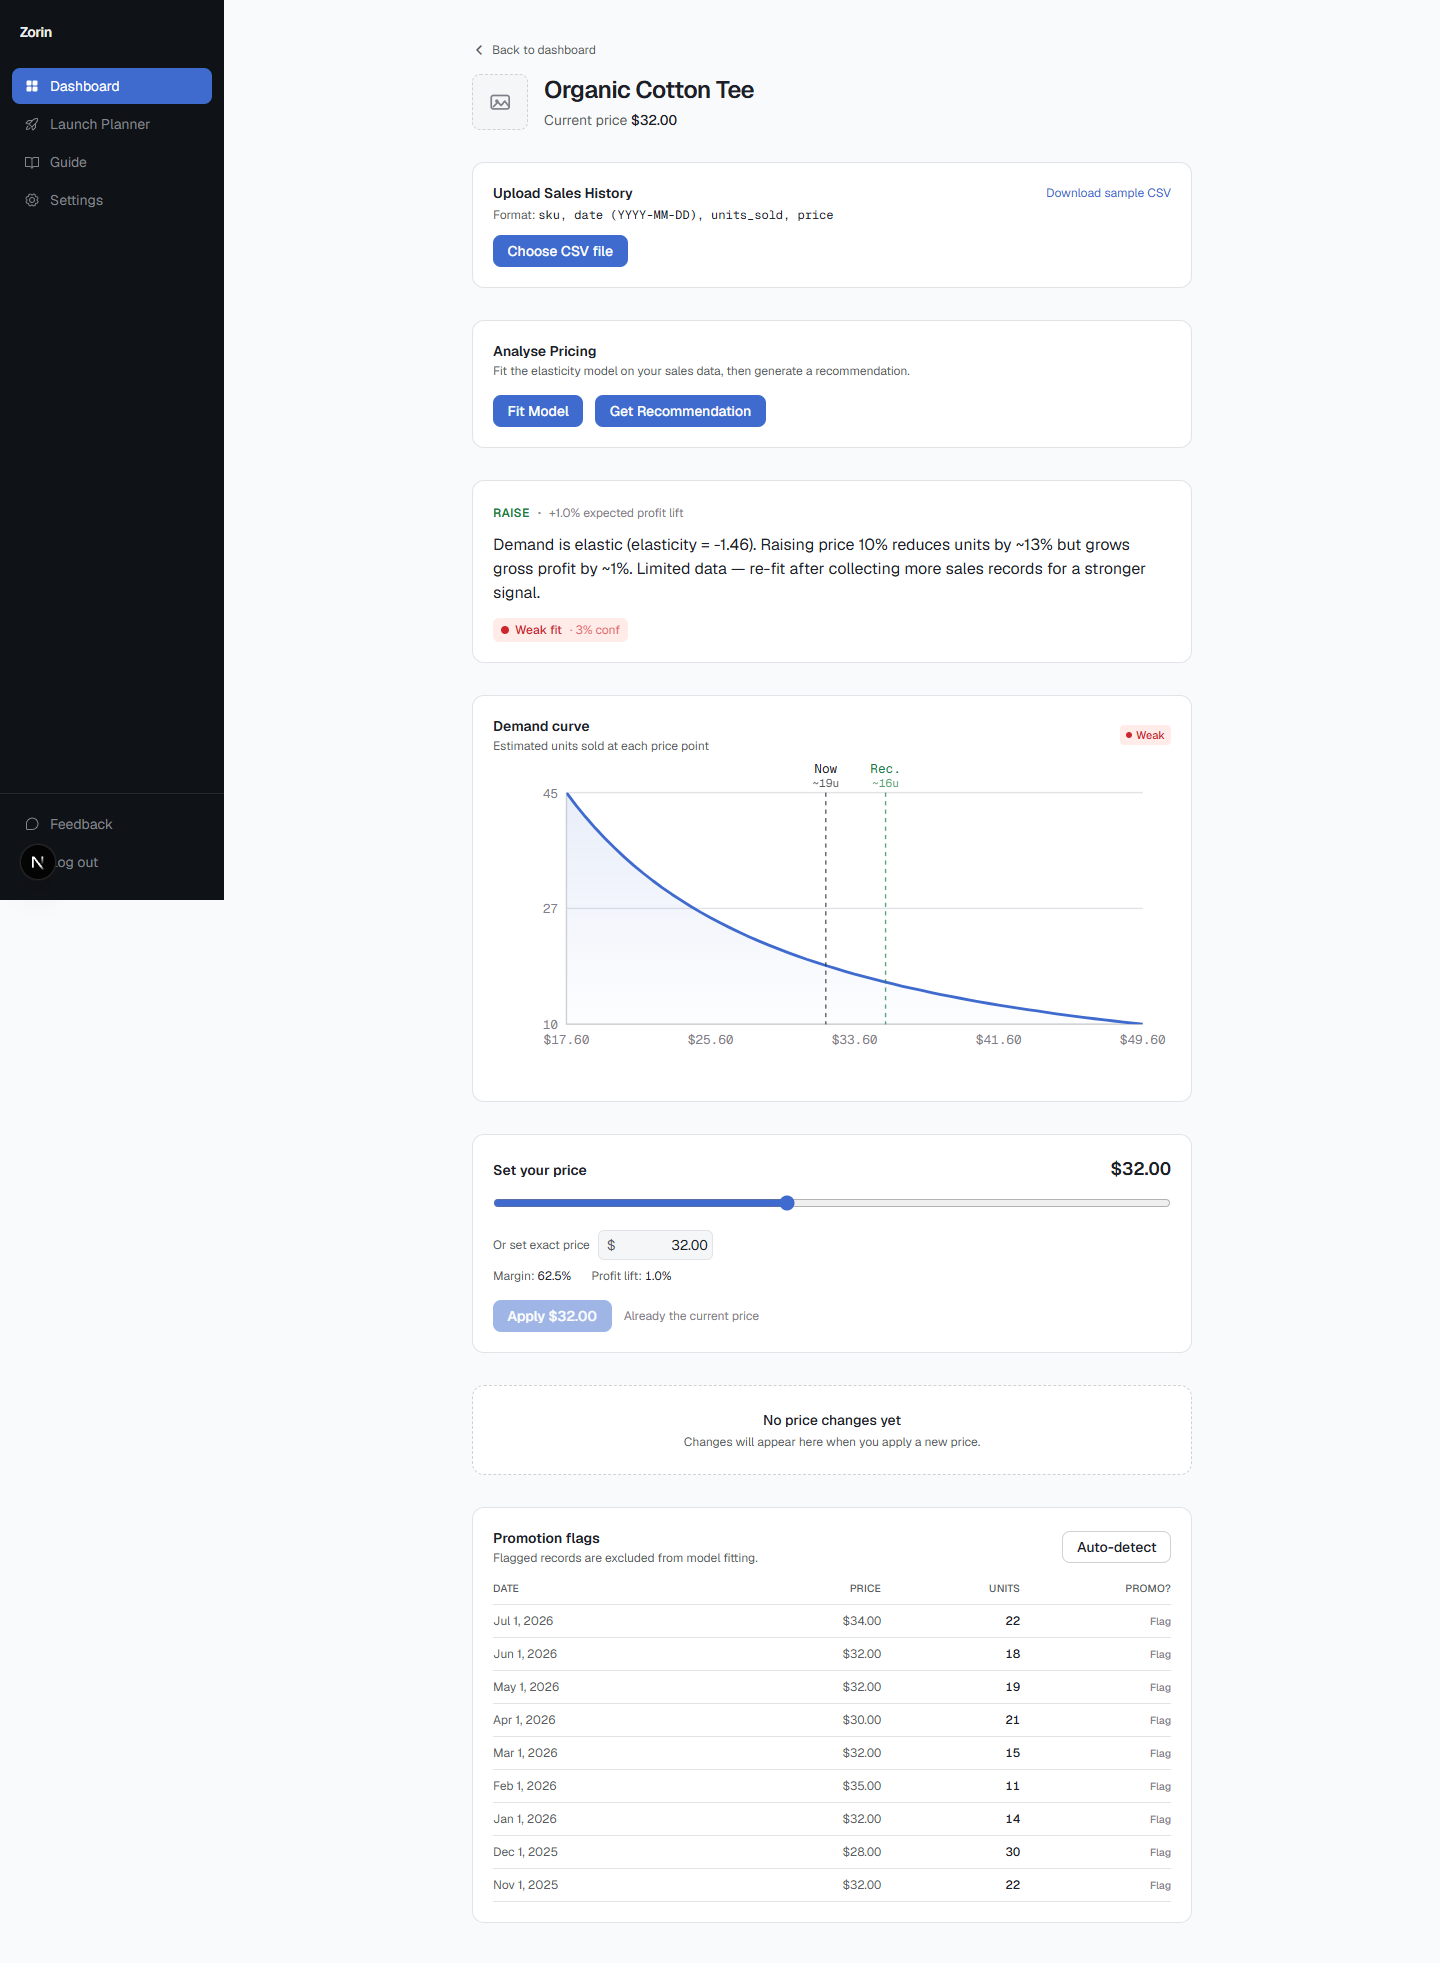
Zorin calculates this exact coefficient for you automatically, fit from your own sales history rather than a category benchmark, alongside an R-squared fit score and a confidence label (commonly Strong, Fair, or Weak) based on how much real price variation and data actually support the estimate. Knowing what the underlying number means gives useful context for how confidently to follow a raise recommendation on a specific product, a Strong-confidence -1.6 deserves more trust than a Weak-confidence one, versus treating every recommendation with the same level of caution.
The takeaway: benchmark your elasticity against your category rather than chasing a universal "good" number, and treat any score above roughly 3.5 as a likely data issue worth double checking.
Why Do Some Products Have More Elastic Demand Than Others
Elasticity isn't random. It's driven mainly by how many substitutes a product has, how essential it is to the customer, and how easily a customer can compare your price to someone else's.
A few drivers worth understanding:
- Substitute availability. The more easily a customer can switch to a comparable product, the more elastic demand becomes. A specific brand of soda is a classic example: raise the price and shoppers grab the one next to it instead.
- Necessity. Essential goods, water, basic groceries, tend toward inelastic demand because customers keep buying regardless of price. Optional or discretionary purchases tend toward elastic demand, since skipping the purchase entirely is a real option.
- Price transparency. The easier it is to comparison shop, the more elastic demand becomes. Mobile apps that surface real-time price comparisons have made many categories more elastic simply by making the alternative easier to find.
- Brand loyalty. Strong loyalty can make an otherwise elastic category behave inelastically for a specific brand, which is part of why premium electronics or well-known labels often see smaller elasticity than their category average.
This plays out clearly across a real catalog. Products where you're one of several nearly identical listings tend to behave elastically, small price moves shift volume fast. Products with a real point of difference, better reviews, a unique variant, faster shipping, tend to behave far more inelastically, even in categories that are usually price sensitive. This is the same reasoning behind why bestsellers and slow sellers need different pricing strategies, differentiation and demand history both shape where a product actually sits.
The takeaway: elasticity comes down to substitute availability, necessity, price transparency, and brand loyalty, and a product can shift categories entirely based on how differentiated it feels to the customer.
Price Elasticity Examples for Ecommerce Sellers
Seeing real category examples makes elasticity concrete faster than the formula alone, and most ecommerce sellers can place their own products by analogy once they see where familiar categories land.
A rough map across common ecommerce categories:
- Grocery and consumable staples: -0.5 to -0.8. Inelastic. Customers buy roughly the same amount regardless of moderate price shifts.
- Standard consumer electronics: often beyond -1.3. Elastic. Heavy comparison shopping and many close substitutes push this category toward strong price sensitivity.
- Premium electronics brands: -0.6 to -0.8, despite sitting in an otherwise elastic category, thanks to brand loyalty softening price sensitivity.
- Discount or private-label goods in the same categories as name brands: often notably more elastic than the branded version, since customers see them as more interchangeable with each other.
- Subscription and streaming services: frequently adjust pricing based on usage patterns, treating elasticity as a live, ongoing input rather than a one-time calculation.
If you sell across a few different categories, this is a useful exercise even without running the formula: sort your catalog roughly into "customers will comparison shop this" and "customers will buy this regardless," and you already have a working elasticity map before you touch a spreadsheet. If you want the real number instead of an estimate, connect your sales history and let the model calculate it per product.
The takeaway: grocery staples and premium brands tend inelastic, standard electronics and private-label goods tend elastic, and most sellers can roughly place their own catalog using these category patterns as a starting reference.
Frequently Asked Questions
What's the difference between elastic and inelastic demand?
Elastic demand means quantity sold changes a lot when price changes. Inelastic demand means quantity barely changes even with a meaningful price shift. The dividing line sits at an elasticity value of 1.
What's a good price elasticity score for my products?
There's no universal "good" number, it depends on your category and goal. Compare your score to similar products, and treat any value above roughly 3.5 as a likely data quality issue rather than real consumer behavior.
Why do some products have more elastic demand than others?
Mainly substitutability and necessity. Products with many easy alternatives or that aren't essential tend to be more elastic than staples with few real substitutes.
Can you give price elasticity examples for ecommerce sellers?
Grocery staples often run -0.5 to -0.8 (inelastic). Standard consumer electronics often exceed -1.3 (elastic). Premium brands often sit closer to -0.6 to -0.8 despite being in an otherwise elastic category, due to brand loyalty.
How is price elasticity actually calculated?
Divide the percentage change in quantity demanded by the percentage change in price. A result between 0 and -1 signals inelastic demand, below -1 signals elastic demand.
Does a negative elasticity number mean something is wrong?
No. Elasticity is negative for most goods by convention, since price and quantity typically move in opposite directions. It's the expected result, not an error.
Should I raise prices on an inelastic product?
Often yes, since demand won't drop much. Always check the resulting margin, not just the elasticity number, before deciding how far to raise it.
How often should I recalculate elasticity for my products?
Elasticity can shift meaningfully over time due to competition and market changes, so revisit it at least annually or right after a significant price change.
Elasticity isn't a number you calculate once and forget. It's a lens that tells you which products can carry a price increase and which ones will punish you for trying. Once you know where your catalog sits on that spectrum, pricing decisions stop feeling like guesswork. For everyday pricing across a full catalog, Zorin calculates this exact number automatically, per product, from your own sales history, with a confidence score attached, so you're not running this formula by hand for every SKU, the elasticity context in this guide is what makes a specific recommendation easier to read and trust once you see it.
Written by Dexter
Dexter is part of the team at Zorin, building tools that help ecommerce merchants price with data instead of guesswork.