Price Elasticity Tools for Ecommerce: How to Find Your Best Price
If your sales dipped after a price increase, or revenue feels flat even though nothing else changed, the fastest way to find out whether your price is actually the problem is to look at your own sales history through a price elasticity lens: how much demand shifts when price moves. You don't need a data science degree or a competitor spreadsheet to do this. In most cases, the data you need is already sitting in your Shopify or WooCommerce order history.
What Price Elasticity Actually Means for Your Store
Price elasticity of demand measures how much your unit sales change when your price changes, expressed as a percentage. If a 1% price increase causes a 2% drop in units sold, that product has an elasticity of -2, meaning it's elastic. Customers are price-sensitive, and pushing the price up costs you more in volume than you gain in margin.
The reverse is also true. Some products are inelastic: raise the price and demand barely moves. A -0.5 elasticity means a 1% price increase only costs you a 0.5% drop in units. For an inelastic SKU, you're very likely leaving margin on the table.
| Elasticity range | Category | What it means for pricing |
|---|---|---|
| Below -1 (e.g. -1.5, -2.0) | Elastic | Price increases hurt volume more than they help margin. Be cautious raising price. |
| Around -1 | Unit elastic | Revenue stays roughly flat as price moves. Small changes matter less. |
| Above -1 (e.g. -0.3, -0.7) | Inelastic | Demand is sticky. You likely have room to raise price without losing many sales. |
This is the number that actually answers "is my price too high or too low," not a guess based on what a competitor charges or how the price feels.
The Signs Your Prices Are Too High or Too Low
Before running any formal analysis, a few patterns in your own store data usually point in the right direction:
- Conversion rate dropped after a price change, but margin barely improved. That's a sign of elastic demand. You likely overshot.
- Sales volume stayed steady through a price increase. That's a sign of inelastic demand, and a signal you might have room to go higher.
- You raised price and then reversed it because volume "felt" like it dropped too much, without checking whether revenue actually went up or down. This is common. A lot of price increases that get walked back were revenue-positive, the volume drop just felt uncomfortable in the moment.
- You've never changed a given SKU's price, so you have no data to work with yet. That's a real constraint, and it's worth knowing before you try to model anything.
Step-by-Step: Finding Your Best Price
How much sales history you actually need
A lot of elasticity guides quote 12 to 24 months, or in some cases two full years, of sales history as the standard for a reliable estimate. That's true for a rigorous, textbook-grade regression, and if you have that much history with several genuine price changes in it, use it.
But most Shopify and WooCommerce merchants don't have two years of clean price-variation data sitting around, especially on newer SKUs. This is where confidence scoring matters more than an arbitrary cutoff. Rather than refusing to give you an answer until you hit some minimum, a good elasticity tool should tell you how confident it is in the estimate it gives you, so a thinner data set still produces a usable, appropriately caveated recommendation instead of nothing at all. That's the approach built into Zorin: there's no hard sales-history minimum, just a confidence tier attached to every recommendation so you know how much to trust it.
Running the elasticity calculation (or having a tool do it)
Technically, elasticity is estimated with a log-log regression: you take the log of quantity sold and the log of price, fit a line, and the resulting coefficient is your elasticity value. You can do this by hand in a spreadsheet if you have a statistics background and clean data. Realistically, most merchants running dozens or hundreds of SKUs want this automated per SKU rather than done manually one product at a time.
Reading your confidence score
Whatever tool you use, don't treat the elasticity number alone as gospel. Pair it with a confidence or R-squared score. A high elasticity estimate paired with low confidence just means you don't have enough clean price variation yet to trust the number, not that the number is wrong. Treat it as a starting hypothesis, not a final verdict.
Elasticity Tools vs. Competitor Price Tracking (They're Not the Same Thing)
This is where a lot of pricing content gets muddy. There are actually three distinct approaches to "getting your price right", and they answer different questions:
| Approach | What it tells you | Data source |
|---|---|---|
| Competitor price tracking | What rivals charge right now | Scraped or monitored competitor listings |
| Price elasticity modeling | How your own customers respond to your prices | Your own sales history |
| Price sensitivity survey (Van Westendorp) | What customers say they'd be willing to pay | Direct customer responses |
Competitor tracking tells you where the market is. It doesn't tell you what your customers will actually do if you match, undercut, or ignore that price. A competitor's price says nothing about your brand's specific demand curve, your customer base's loyalty, or your product's actual substitutability. Elasticity modeling and price sensitivity surveys both look at your demand directly instead, just from two different angles: one from what customers actually did (revealed preference), the other from what they say they'd pay (stated preference).
Per-SKU Elasticity Tools Built for Shopify and WooCommerce
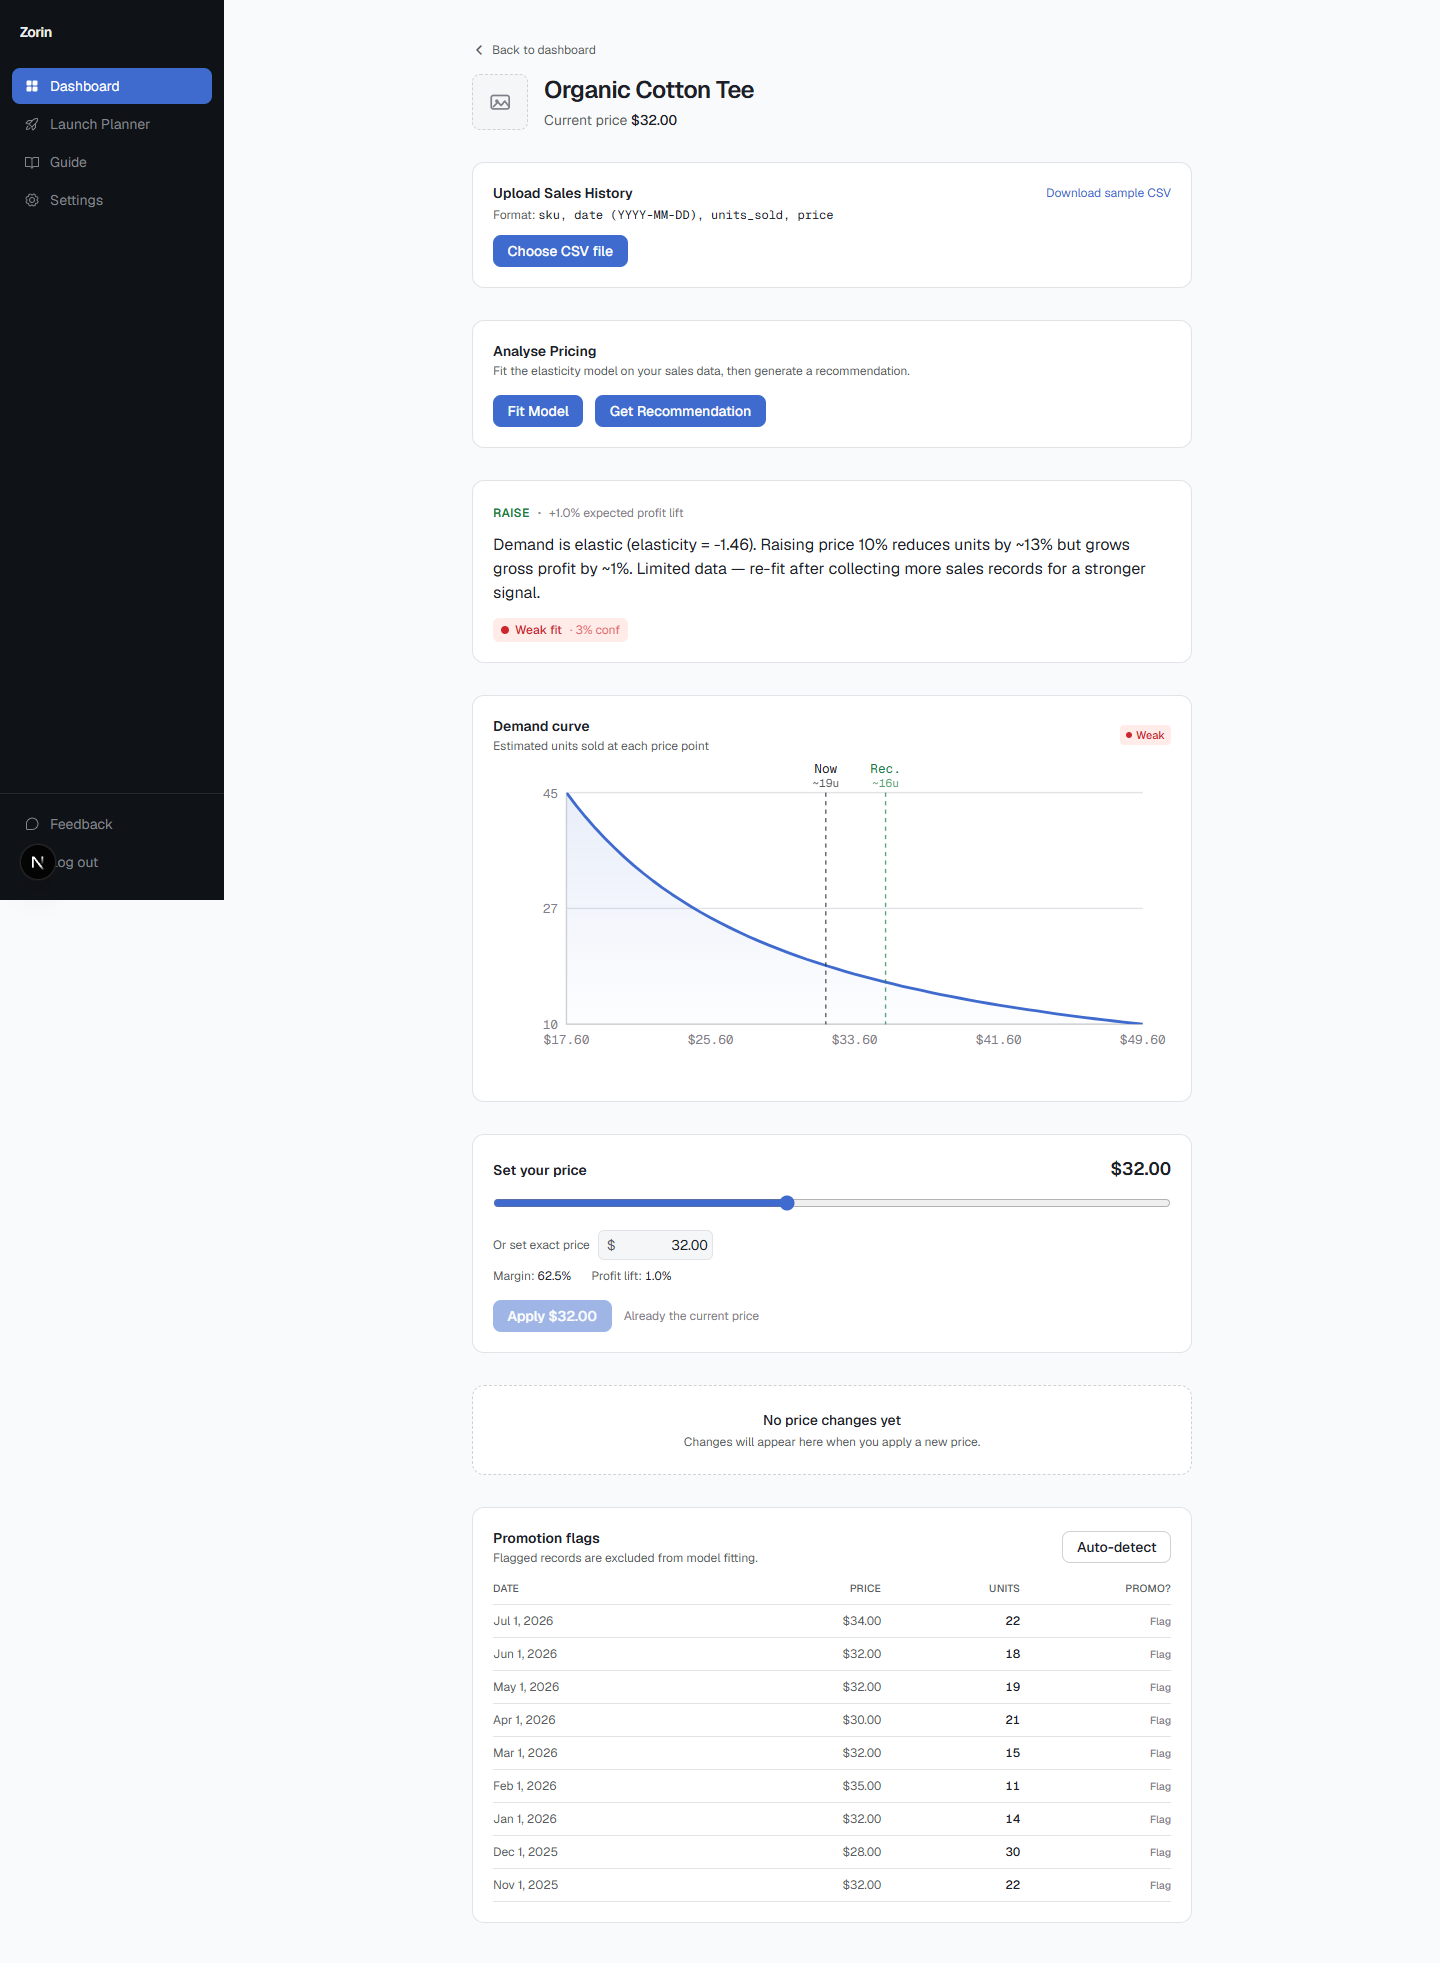
Zorin connects to your Shopify or WooCommerce store, or takes a sales history upload, and fits a log-log regression per SKU rather than treating your whole catalog as one blended average. Each SKU gets its own elasticity estimate, a confidence score based on how much clean price variation is in the data, and a raise, lower, or hold recommendation with an estimated profit lift. It deliberately does not scrape or compare against competitor prices. The recommendation is grounded entirely in what your own customers did when your prices moved, not in what a rival storefront happens to be charging this week.
This matters if you've tried general-purpose pricing tools before. Some platforms lean heavily on live A/B price testing. Intelligems, for example, is a well-regarded Shopify app for running real-time price tests, and its Profit Optimization plan starts around $499 a month scaling with order volume, with plans built around measuring profit per visitor across live test groups. That's a genuinely different approach: you're testing prices in the wild, in real time, which requires meaningful order volume to reach statistical significance before you get an answer. Elasticity modeling instead works retrospectively on data you already have, so you get a starting recommendation before you commit to running a live test on real customers.
When to Add a Price Sensitivity Survey
Elasticity modeling has one obvious blind spot: it needs price variation to work with. A brand-new SKU that's never had its price changed, or a SKU with very low order volume, won't produce a confident elasticity estimate no matter how good the model is.
This is where a stated-preference method like the Van Westendorp Price Sensitivity Meter earns its place. It's a short, four-question survey that asks customers at what price a product would feel too cheap, cheap, expensive, and too expensive. Plotting the responses gives you four reference points: the Point of Marginal Cheapness and Point of Marginal Expensiveness, which together bound your acceptable price corridor, plus an Indifference Price Point and an Optimal Price Point where price resistance from either direction balances out.
It's a different kind of evidence than elasticity, stated rather than revealed, so the two stay conceptually separate in Zorin rather than being blended into one number. But for a new product launch or a low-confidence SKU where you don't have enough sales history yet, a Van Westendorp survey gives you a second, independent signal to anchor a starting price before real sales data exists to model.
Key Takeaways
- Price elasticity measures how much unit sales change when price changes, the number that actually answers "is my price too high or too low."
- Elastic products (elasticity below -1) lose more in volume than they gain in margin from a price increase. Inelastic products (above -1) usually have room to raise price.
- Confidence scoring matters more than a hard sales-history minimum, a thinner data set can still produce a usable, appropriately caveated recommendation.
- Competitor price tracking, elasticity modeling, and price sensitivity surveys answer three different questions and aren't interchangeable.
- A Van Westendorp survey fills the gap elasticity modeling can't: pricing a new or low-data SKU that doesn't have enough price variation to model yet.
Frequently Asked Questions
Is my ecommerce price too high or too low?
Look at what happened the last time the price changed. If volume barely moved, you likely have room to raise it. If volume dropped sharply relative to the price increase, you probably overshot. A price elasticity estimate from your own sales data answers this more precisely than guesswork.
What's the difference between competitor price tracking and price elasticity software?
Competitor tracking monitors what rivals charge. Price elasticity software models how your own customers respond to your prices using your sales history. They answer different questions and aren't interchangeable.
How much sales data do I need to calculate price elasticity?
Rigorous academic estimates often call for 12 to 24 months of history with real price variation. In practice, a tool with confidence scoring can still give you a usable, appropriately caveated recommendation with less data than that.
Is price elasticity modeling the same as A/B price testing?
No. A/B testing (like Intelligems on Shopify) runs live experiments on real traffic in real time. Elasticity modeling analyzes historical sales data you already have to estimate demand response before you test anything live.
What is per-SKU elasticity, and why does it matter?
It means calculating a separate elasticity estimate for each individual product rather than one blended number for your whole catalog. Different SKUs respond to price changes very differently, so a single average can hide which products actually have room to move.
What is the Van Westendorp Price Sensitivity Meter?
A four-question customer survey that identifies an acceptable price range and an optimal price point based on what customers say they'd be willing to pay. It's useful for new products or low-data SKUs where elasticity modeling doesn't have enough history to work with yet.
Can I calculate price elasticity myself in a spreadsheet?
Yes, if you're comfortable with log-log regression and have clean sales and price data. Most merchants managing more than a handful of SKUs find it faster to use a tool that automates this per product.
What does a "raise, lower, or hold" recommendation actually mean?
It's a suggested pricing action based on your product's estimated elasticity and projected profit impact. It should always come with a confidence score, since a low-confidence recommendation is a starting hypothesis, not a final decision.
Zorin uses your own Shopify or WooCommerce sales history to model per-SKU price elasticity, so you're not left guessing whether a price change will help or hurt. If you want a starting point on a new product before you have enough sales history to model, the Van Westendorp survey inside Zorin can give you a defensible price range in the meantime. Start a free trial and see what your own catalog's elasticity actually looks like.
Written by Dexter
Dexter is part of the team at Zorin, building tools that help ecommerce merchants price with data instead of guesswork.