How Do I Calculate My Own Price Elasticity Without a Data Scientist?
Two merchants sell a similar product at the same price, and both raise it by 10% to cover rising costs. A month later, one is celebrating, the higher price stuck, volume barely moved, and profit is up. The other is staring at a sales dashboard that's dropped off a cliff. Nothing went wrong for the second merchant, their product just had a different price elasticity, how much quantity sold actually moves when price does, and neither of them knew the number going in. The basic formula for that number is percentage change in quantity sold divided by percentage change in price, and you can calculate it in a spreadsheet from two price points you've already tried, no statistics background required.
Why This Number Matters More Than It Sounds Like It Should
Elasticity isn't an abstract economics term, it's the answer to the one question every pricing decision actually depends on: if I change this price, what happens to how much I sell? Get that answer right and a price increase quietly adds profit. Get it wrong and the same price increase drives customers to a competitor, or the same discount trains them to wait for the next one instead of buying now. The dollar amount of the price change is rarely what determines the outcome, the underlying elasticity is.
Most merchants make pricing calls on instinct, a gut sense of what customers will tolerate, sometimes right, sometimes expensive. Elasticity replaces the guess with a measurement. It won't tell you what price to charge, that still depends on margin, strategy, and positioning, but it will tell you how a given customer base is likely to react before you find out the hard way. That's what the rest of this guide is actually building toward, not the formula for its own sake, but a real number for a real product, calculated from your own sales history instead of a hunch.
The Formula, in Plain Terms
Price elasticity of demand is the percentage change in quantity demanded divided by the percentage change in price. That's the whole formula. If a 10% price increase causes a 15% drop in units sold, elasticity is -15% ÷ 10% = -1.5. If the same price increase only causes a 4% drop, elasticity is -4% ÷ 10% = -0.4. The first product is elastic, the second is inelastic, and neither calculation required anything beyond division.
A Worked Example You Can Copy
Say a product sold 400 units a month at $20. You raised the price to $22, and the following month it sold 340 units. Here's the calculation:
| Step | Calculation | Result |
|---|---|---|
| % change in price | ($22 - $20) ÷ $20 | +10% |
| % change in quantity | (340 - 400) ÷ 400 | -15% |
| Elasticity | -15% ÷ 10% | -1.5 (elastic) |
A coefficient of -1.5 means demand is elastic, quantity fell by more than the price rose, so this particular increase likely cost more in lost volume than it gained in higher price per unit. Worth checking against what elastic versus inelastic actually means for revenue before deciding whether to roll the price back.
Use the Midpoint Method to Avoid a Common Mistake
The simple percentage calculation above has a flaw: it gives a different answer depending on which price you treat as the starting point. Going from $20 to $22 is a 10% increase, but going from $22 back to $20 is a 9.1% decrease, not 10%, because the base changed. That asymmetry can meaningfully shift your elasticity number depending on which direction you calculate it.
The fix is the midpoint method: divide the change by the average of the two values instead of the starting value.
| Step | Calculation | Result |
|---|---|---|
| % change in price (midpoint) | ($22 - $20) ÷ (($22 + $20) ÷ 2) | 9.5% |
| % change in quantity (midpoint) | (340 - 400) ÷ ((340 + 400) ÷ 2) | -16.2% |
| Elasticity (midpoint method) | -16.2% ÷ 9.5% | -1.71 |
The midpoint version gives a slightly different, more consistent number, and it's the version economists actually use when reporting elasticity from two observed points. If you're doing this in a spreadsheet, build the midpoint formula once and reuse it, it's the same handful of cells for every product.
What This Rough Number Can't Tell You
A two-point calculation is a real elasticity estimate, but it's a noisy one, and it's worth knowing where the noise comes from before you act on it.
- Seasonality. If the price change happened to coincide with a seasonal dip or spike in demand, the calculation attributes all of that swing to price, when some or most of it wasn't.
- Other changes at the same time. A promotion, a competitor's price move, a change in shipping cost, or even a different product going out of stock can all shift sales independent of your price change.
- Small sample size. One month of data before and after is two data points. A single unusual week can swing the whole number.
- No confidence read. The formula gives you a number, but not a sense of how much to trust it. -1.5 calculated from a clean, isolated price test means something different than -1.5 calculated from a chaotic month with five other things going on.
None of this makes the two-point method useless, it's a legitimate way to get a directional read fast. It just means treating the result as a strong hint rather than a precise measurement, especially for a decision as consequential as a storewide price change.
When You Need the Real Regression Instead
The more rigorous version of the same idea is a log-log regression across many price-and-quantity observations rather than just two. Instead of one before-and-after comparison, it fits a line through every price point in your sales history and reads the slope of that line as the elasticity coefficient. This is the actual method behind a calculated elasticity coefficient, and it comes with two things the two-point formula can't give you: it averages out the noise from any single unusual period instead of being fully exposed to it, and it produces an R-squared value, a direct measure of how much you should trust the number.
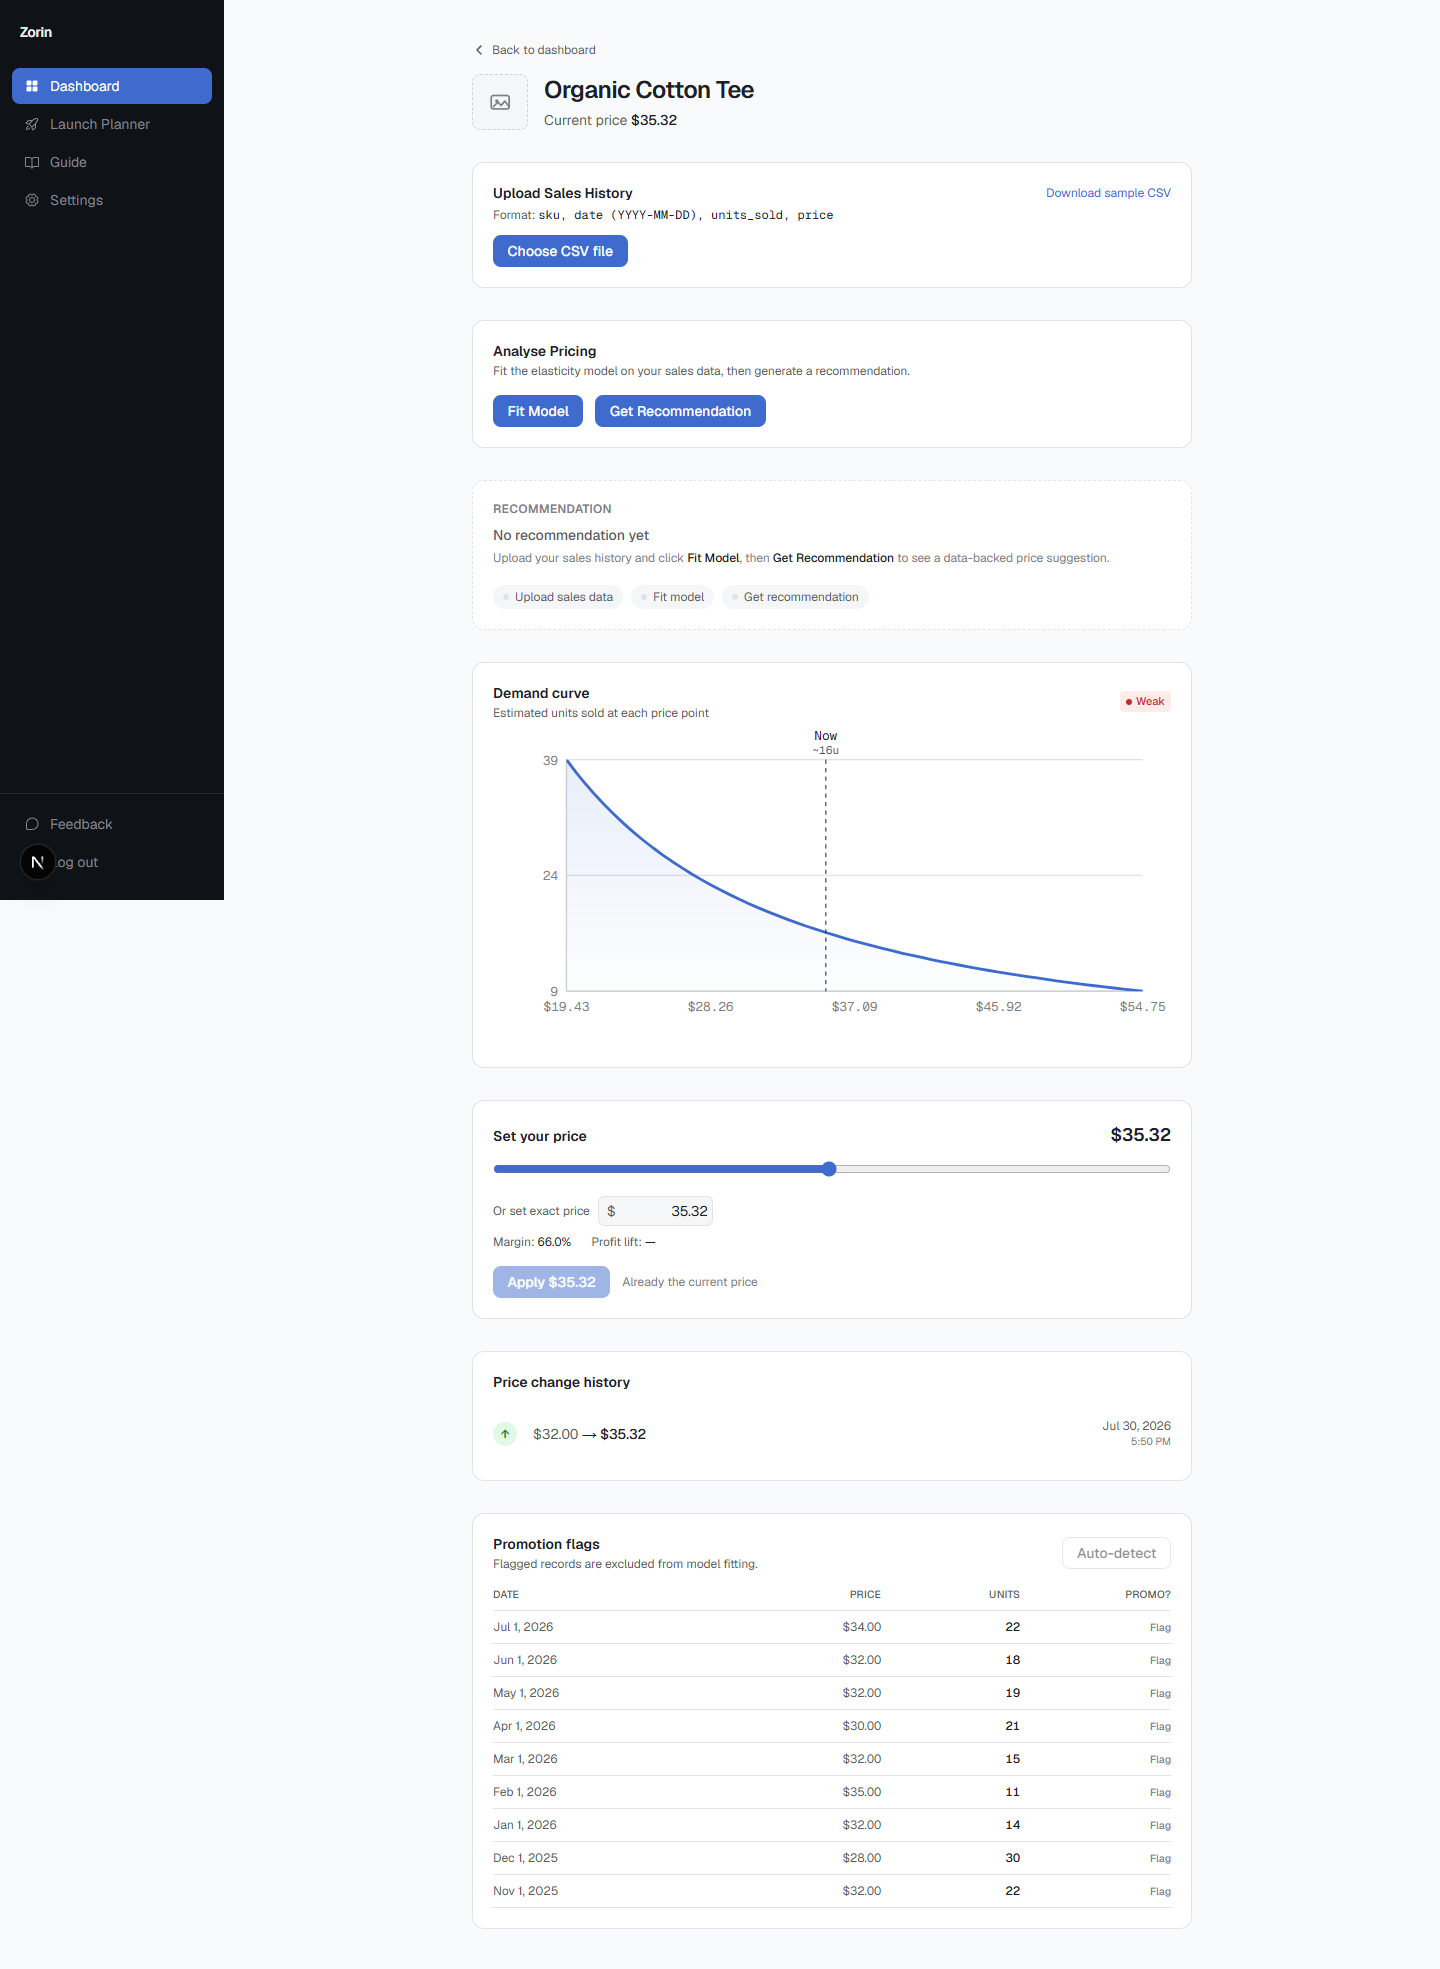
You don't need to run this yourself. Connect your sales history and Zorin fits the regression per SKU automatically, returning the coefficient alongside a confidence score, so you can see at a glance which recommendations are backed by clean, consistent data and which ones are closer to a guess dressed up as a number.
If you'd rather skip the spreadsheet entirely, connect your sales history and get the real coefficient, with a confidence score, for every product in your catalog.
Key Takeaways
- The formula is (% change in quantity) ÷ (% change in price), calculated from any two periods where the price actually changed.
- Use the midpoint method for the percentage changes, it avoids the formula giving you a different answer depending on whether you calculate a price increase or its reverse decrease.
- A two-point calculation is a rough estimate, it doesn't control for seasonality, promotions, or other products changing price at the same time, all of which can distort the number.
- You need real price variation in your sales history to calculate anything at all, a product that's never changed price has no elasticity to measure yet.
- A proper log-log regression across many price points does what the two-point formula does, but averages out the noise and adds a confidence score, which is the difference between a rough estimate and a number you can act on.
Frequently Asked Questions
What's the simplest formula for calculating price elasticity?
Percentage change in quantity sold divided by percentage change in price. If you have two periods where the price differed, you can calculate a rough elasticity estimate from those numbers alone.
Do I need a statistics background to calculate elasticity?
No. A two-point calculation is basic division. Getting a more reliable number from many price points does use regression, but you don't need to run that yourself, tools that connect to your sales history can calculate it automatically.
What's the midpoint method and why does it matter?
It calculates percentage changes using the average of the two values as the base instead of the starting value, which avoids getting a different elasticity number depending on whether you calculate a price increase or its reverse.
Can I calculate elasticity if my price has never changed?
No. Elasticity measures how quantity responds to a price change, so you need at least one instance of the price actually changing in your sales history to calculate anything.
Why is a two-point elasticity calculation less reliable than a regression?
A two-point calculation can't separate the effect of the price change from other things happening at the same time, seasonality, promotions, competitor moves, and it has no way to tell you how much to trust the result. A regression across many price points averages out that noise and produces a confidence measure alongside the coefficient.
How many price changes do I need before the number becomes reliable?
There's no fixed minimum, but more price variation and more sales data generally produce a tighter, more trustworthy estimate. A single before-and-after comparison is usable but rough, several price points over time, ideally isolated from other changes, get you much closer to a real answer.
You don't need a data scientist to get a usable elasticity number, just two price points, the sales they produced, and the formula above. It won't be as clean as a full regression, but it's often enough to tell you whether a product can take a price increase, which is the question you're actually trying to answer.
Written by Dexter
Dexter is part of the team at Zorin, building tools that help ecommerce merchants price with data instead of guesswork.